
How Do Texmaco Rail & Engineering Limited’s (NSE:TEXRAIL) Returns On Capital Compare To Peers?

Today we are going to look at Texmaco Rail & Engineering Limited (NSE:TEXRAIL) to see whether it might be an attractive investment prospect. To be precise, we’ll consider its Return On Capital Employed (ROCE), as that will inform our view of the quality of the business.
First of all, we’ll work out how to calculate ROCE. Next, we’ll compare it to others in its industry. And finally, we’ll look at how its current liabilities are impacting its ROCE.
What is Return On Capital Employed (ROCE)?
ROCE is a metric for evaluating how much pre-tax income (in percentage terms) a company earns on the capital invested in its business. In general, businesses with a higher ROCE are usually better quality. Ultimately, it is a useful but imperfect metric. Renowned investment researcher Michael Mauboussin has suggested that a high ROCE can indicate that ‘one dollar invested in the company generates value of more than one dollar’.
So, How Do We Calculate ROCE?
Analysts use this formula to calculate return on capital employed:
Return on Capital Employed = Earnings Before Interest and Tax (EBIT) ÷ (Total Assets – Current Liabilities)
Or for Texmaco Rail & Engineering:
0.035 = ₹391m ÷ (₹23b – ₹11b) (Based on the trailing twelve months to March 2018.)
Therefore, Texmaco Rail & Engineering has an ROCE of 3.5%.
See our latest analysis for Texmaco Rail & Engineering
Want to help shape the future of investing tools and platforms? Take the survey and be part of one of the most advanced studies of stock market investors to date.
Does Texmaco Rail & Engineering Have A Good ROCE?
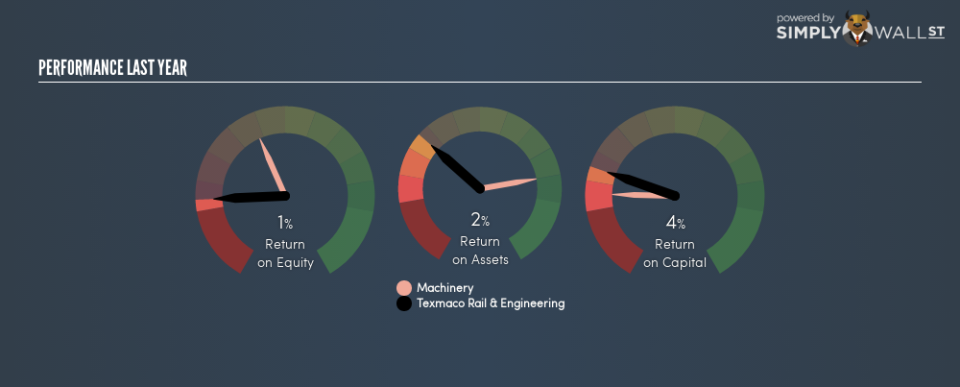
One way to assess ROCE is to compare similar companies. We can see Texmaco Rail & Engineering’s ROCE is meaningfully below the Machinery industry average of 15%. This could be seen as a negative, as it suggests some competitors may be employing their capital more efficiently. Putting aside Texmaco Rail & Engineering’s performance relative to its industry, its ROCE in absolute terms is poor – considering the risk of owning stocks compared to government bonds. Readers may wish to look for more rewarding investments.
As we can see, Texmaco Rail & Engineering currently has an ROCE of 3.5% compared to its ROCE 3 years ago, which was 1.4%. This makes us wonder if the company is improving.
It is important to remember that ROCE shows past performance, and is not necessarily predictive. ROCE can be deceptive for cyclical businesses, as returns can look incredible in boom times, and terribly low in downturns. ROCE is only a point-in-time measure. Future performance is what matters, and you can see analyst predictions in our free report on analyst forecasts for the company.
Texmaco Rail & Engineering’s Current Liabilities And Their Impact On Its ROCE
Current liabilities are short term bills and invoices that need to be paid in 12 months or less. Due to the way the ROCE equation works, having large bills due in the near term can make it look as though a company has less capital employed, and thus a higher ROCE than usual. To check the impact of this, we calculate if a company has high current liabilities relative to its total assets.
Texmaco Rail & Engineering has total assets of ₹23b and current liabilities of ₹11b. As a result, its current liabilities are equal to approximately 51% of its total assets. This is a fairly high level of current liabilities, boosting Texmaco Rail & Engineering’s ROCE.
What We Can Learn From Texmaco Rail & Engineering’s ROCE
Texmaco Rail & Engineering’s ROCE in absolute terms is poor, and there are likely better investment prospects out there. Of course, you might find a fantastic investment by looking at a few good candidates. So take a peek at this free list of companies with modest (or no) debt, trading on a P/E below 20.
If you are like me, then you will not want to miss this free list of growing companies that insiders are buying.
To help readers see past the short term volatility of the financial market, we aim to bring you a long-term focused research analysis purely driven by fundamental data. Note that our analysis does not factor in the latest price-sensitive company announcements.
The author is an independent contributor and at the time of publication had no position in the stocks mentioned. For errors that warrant correction please contact the editor at editorial-team@simplywallst.com.

