Thelloy Development Group Limited (HKG:1546) Earns Among The Best Returns In Its Industry

Today we’ll evaluate Thelloy Development Group Limited (HKG:1546) to determine whether it could have potential as an investment idea. Specifically, we’ll consider its Return On Capital Employed (ROCE), since that will give us an insight into how efficiently the business can generate profits from the capital it requires.
First of all, we’ll work out how to calculate ROCE. Second, we’ll look at its ROCE compared to similar companies. Finally, we’ll look at how its current liabilities affect its ROCE.
What is Return On Capital Employed (ROCE)?
ROCE measures the ‘return’ (pre-tax profit) a company generates from capital employed in its business. In general, businesses with a higher ROCE are usually better quality. Overall, it is a valuable metric that has its flaws. Author Edwin Whiting says to be careful when comparing the ROCE of different businesses, since ‘No two businesses are exactly alike.’
So, How Do We Calculate ROCE?
Analysts use this formula to calculate return on capital employed:
Return on Capital Employed = Earnings Before Interest and Tax (EBIT) ÷ (Total Assets – Current Liabilities)
Or for Thelloy Development Group:
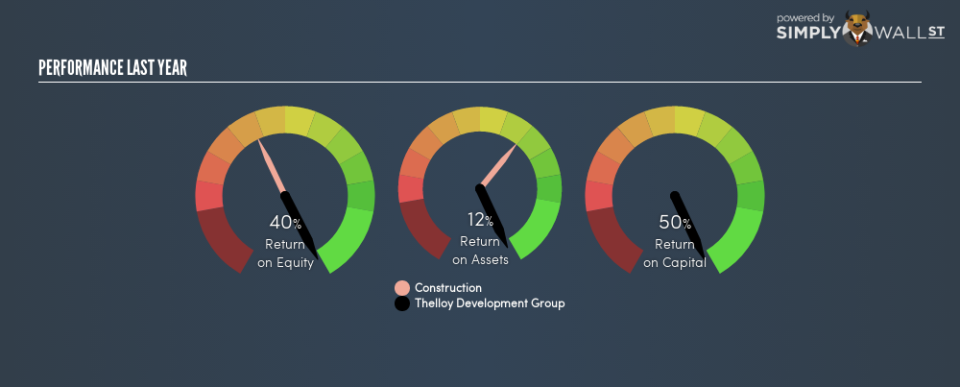
0.50 = HK$75m ÷ (HK$426m – HK$299m) (Based on the trailing twelve months to September 2018.)
So, Thelloy Development Group has an ROCE of 50%.
See our latest analysis for Thelloy Development Group
Want to help shape the future of investing tools and platforms? Take the survey and be part of one of the most advanced studies of stock market investors to date.
Is Thelloy Development Group’s ROCE Good?
When making comparisons between similar businesses, investors may find ROCE useful. In our analysis, Thelloy Development Group’s ROCE is meaningfully higher than the 14% average in the Construction industry. I think that’s good to see, since it implies the company is better than other companies at making the most of its capital. Setting aside the comparison to its industry for a moment, Thelloy Development Group’s ROCE in absolute terms currently looks quite high.
Thelloy Development Group’s current ROCE of 50% is lower than 3 years ago, when the company reported a 97% ROCE. This makes us wonder if the business is facing new challenges.
Remember that this metric is backwards looking – it shows what has happened in the past, and does not accurately predict the future. Companies in cyclical industries can be difficult to understand using ROCE, as returns typically look high during boom times, and low during busts. ROCE is, after all, simply a snap shot of a single year. How cyclical is Thelloy Development Group? You can see for yourself by looking at this free graph of past earnings, revenue and cash flow.
Thelloy Development Group’s Current Liabilities And Their Impact On Its ROCE
Liabilities, such as supplier bills and bank overdrafts, are referred to as current liabilities if they need to be paid within 12 months. The ROCE equation subtracts current liabilities from capital employed, so a company with a lot of current liabilities appears to have less capital employed, and a higher ROCE than otherwise. To counteract this, we check if a company has high current liabilities, relative to its total assets.
Thelloy Development Group has total assets of HK$426m and current liabilities of HK$299m. As a result, its current liabilities are equal to approximately 70% of its total assets. While a high level of current liabilities boosts its ROCE, Thelloy Development Group’s returns are still very good.
The Bottom Line On Thelloy Development Group’s ROCE
So to us, the company is potentially worth investigating further. But note: Thelloy Development Group may not be the best stock to buy. So take a peek at this free list of interesting companies with strong recent earnings growth (and a P/E ratio below 20).
If you like to buy stocks alongside management, then you might just love this free list of companies. (Hint: insiders have been buying them).
To help readers see past the short term volatility of the financial market, we aim to bring you a long-term focused research analysis purely driven by fundamental data. Note that our analysis does not factor in the latest price-sensitive company announcements.
The author is an independent contributor and at the time of publication had no position in the stocks mentioned. For errors that warrant correction please contact the editor at editorial-team@simplywallst.com.
