We Think ECA (EPA:ECASA) Can Stay On Top Of Its Debt

Warren Buffett famously said, 'Volatility is far from synonymous with risk.' So it might be obvious that you need to consider debt, when you think about how risky any given stock is, because too much debt can sink a company. We note that ECA SA (EPA:ECASA) does have debt on its balance sheet. But is this debt a concern to shareholders?
What Risk Does Debt Bring?
Debt and other liabilities become risky for a business when it cannot easily fulfill those obligations, either with free cash flow or by raising capital at an attractive price. In the worst case scenario, a company can go bankrupt if it cannot pay its creditors. However, a more frequent (but still costly) occurrence is where a company must issue shares at bargain-basement prices, permanently diluting shareholders, just to shore up its balance sheet. Of course, debt can be an important tool in businesses, particularly capital heavy businesses. When we think about a company's use of debt, we first look at cash and debt together.
View our latest analysis for ECA
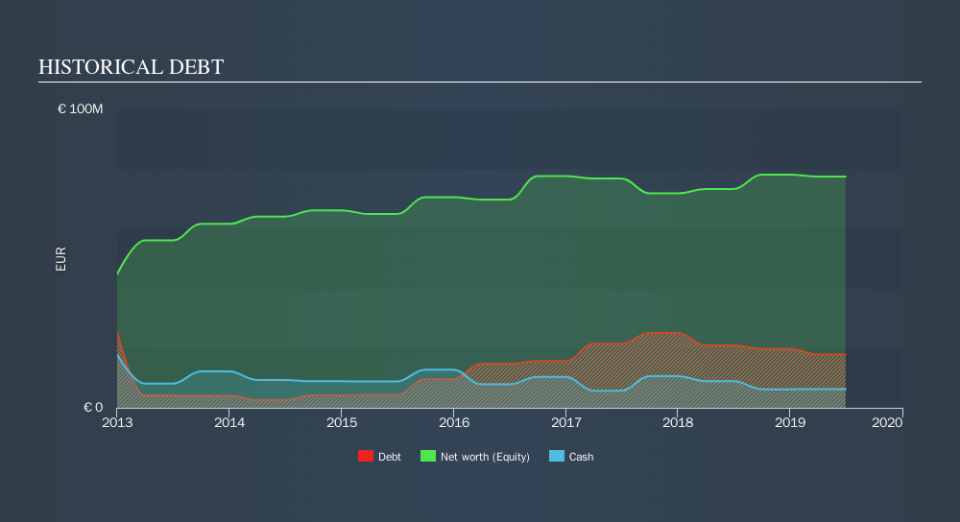
What Is ECA's Debt?
You can click the graphic below for the historical numbers, but it shows that ECA had €17.9m of debt in June 2019, down from €21.1m, one year before. However, it also had €6.23m in cash, and so its net debt is €11.6m.
How Healthy Is ECA's Balance Sheet?
We can see from the most recent balance sheet that ECA had liabilities of €81.4m falling due within a year, and liabilities of €20.9m due beyond that. On the other hand, it had cash of €6.23m and €87.0m worth of receivables due within a year. So it has liabilities totalling €9.06m more than its cash and near-term receivables, combined.
Given ECA has a market capitalization of €231.0m, it's hard to believe these liabilities pose much threat. However, we do think it is worth keeping an eye on its balance sheet strength, as it may change over time.
We measure a company's debt load relative to its earnings power by looking at its net debt divided by its earnings before interest, tax, depreciation, and amortization (EBITDA) and by calculating how easily its earnings before interest and tax (EBIT) cover its interest expense (interest cover). This way, we consider both the absolute quantum of the debt, as well as the interest rates paid on it.
ECA has net debt of just 1.1 times EBITDA, suggesting it could ramp leverage without breaking a sweat. But the really cool thing is that it actually managed to receive more interest than it paid, over the last year. So it's fair to say it can handle debt like a hot shot teppanyaki chef handles cooking. Even more impressive was the fact that ECA grew its EBIT by 111% over twelve months. That boost will make it even easier to pay down debt going forward. The balance sheet is clearly the area to focus on when you are analysing debt. But ultimately the future profitability of the business will decide if ECA can strengthen its balance sheet over time. So if you're focused on the future you can check out this free report showing analyst profit forecasts.
Finally, while the tax-man may adore accounting profits, lenders only accept cold hard cash. So we clearly need to look at whether that EBIT is leading to corresponding free cash flow. Over the last three years, ECA recorded negative free cash flow, in total. Debt is far more risky for companies with unreliable free cash flow, so shareholders should be hoping that the past expenditure will produce free cash flow in the future.
Our View
ECA's interest cover suggests it can handle its debt as easily as Cristiano Ronaldo could score a goal against an under 14's goalkeeper. But the stark truth is that we are concerned by its conversion of EBIT to free cash flow. All these things considered, it appears that ECA can comfortably handle its current debt levels. On the plus side, this leverage can boost shareholder returns, but the potential downside is more risk of loss, so it's worth monitoring the balance sheet. Over time, share prices tend to follow earnings per share, so if you're interested in ECA, you may well want to click here to check an interactive graph of its earnings per share history.
Of course, if you're the type of investor who prefers buying stocks without the burden of debt, then don't hesitate to discover our exclusive list of net cash growth stocks, today.
We aim to bring you long-term focused research analysis driven by fundamental data. Note that our analysis may not factor in the latest price-sensitive company announcements or qualitative material.
If you spot an error that warrants correction, please contact the editor at editorial-team@simplywallst.com. This article by Simply Wall St is general in nature. It does not constitute a recommendation to buy or sell any stock, and does not take account of your objectives, or your financial situation. Simply Wall St has no position in the stocks mentioned. Thank you for reading.

