What We Think Of Sichuan Expressway Company Limited’s (HKG:107) Investment Potential

Today we'll look at Sichuan Expressway Company Limited (HKG:107) and reflect on its potential as an investment. Specifically, we're going to calculate its Return On Capital Employed (ROCE), in the hopes of getting some insight into the business.
First, we'll go over how we calculate ROCE. Then we'll compare its ROCE to similar companies. Finally, we'll look at how its current liabilities affect its ROCE.
What is Return On Capital Employed (ROCE)?
ROCE is a measure of a company's yearly pre-tax profit (its return), relative to the capital employed in the business. In general, businesses with a higher ROCE are usually better quality. Ultimately, it is a useful but imperfect metric. Renowned investment researcher Michael Mauboussin has suggested that a high ROCE can indicate that 'one dollar invested in the company generates value of more than one dollar'.
So, How Do We Calculate ROCE?
Analysts use this formula to calculate return on capital employed:
Return on Capital Employed = Earnings Before Interest and Tax (EBIT) ÷ (Total Assets - Current Liabilities)
Or for Sichuan Expressway:
0.058 = CN¥1.9b ÷ (CN¥37b - CN¥4.7b) (Based on the trailing twelve months to March 2019.)
So, Sichuan Expressway has an ROCE of 5.8%.
View our latest analysis for Sichuan Expressway
Is Sichuan Expressway's ROCE Good?
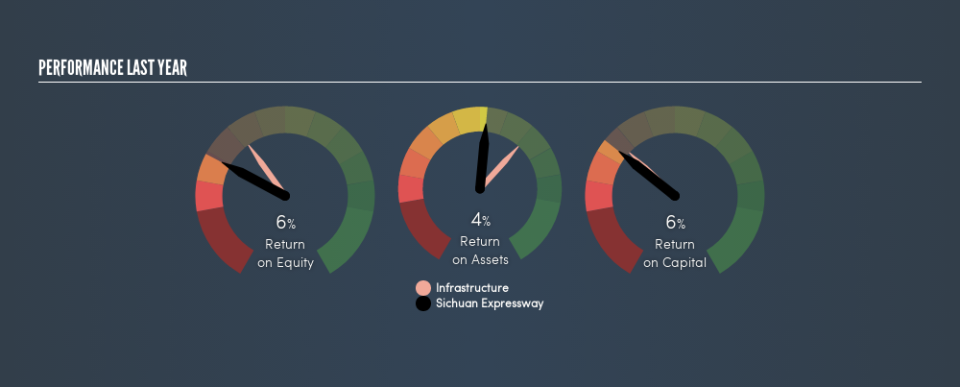
When making comparisons between similar businesses, investors may find ROCE useful. It appears that Sichuan Expressway's ROCE is fairly close to the Infrastructure industry average of 7.3%. Aside from the industry comparison, Sichuan Expressway's ROCE is mediocre in absolute terms, considering the risk of investing in stocks versus the safety of a bank account. It is possible that there are more rewarding investments out there.
You can click on the image below to see (in greater detail) how Sichuan Expressway's past growth compares to other companies.
Remember that this metric is backwards looking - it shows what has happened in the past, and does not accurately predict the future. ROCE can be deceptive for cyclical businesses, as returns can look incredible in boom times, and terribly low in downturns. This is because ROCE only looks at one year, instead of considering returns across a whole cycle. What happens in the future is pretty important for investors, so we have prepared a free report on analyst forecasts for Sichuan Expressway.
Do Sichuan Expressway's Current Liabilities Skew Its ROCE?
Short term (or current) liabilities, are things like supplier invoices, overdrafts, or tax bills that need to be paid within 12 months. The ROCE equation subtracts current liabilities from capital employed, so a company with a lot of current liabilities appears to have less capital employed, and a higher ROCE than otherwise. To counter this, investors can check if a company has high current liabilities relative to total assets.
Sichuan Expressway has total assets of CN¥37b and current liabilities of CN¥4.7b. Therefore its current liabilities are equivalent to approximately 13% of its total assets. This is a modest level of current liabilities, which would only have a small effect on ROCE.
The Bottom Line On Sichuan Expressway's ROCE
That said, Sichuan Expressway's ROCE is mediocre, there may be more attractive investments around. Of course, you might find a fantastic investment by looking at a few good candidates. So take a peek at this free list of companies with modest (or no) debt, trading on a P/E below 20.
For those who like to find winning investments this free list of growing companies with recent insider purchasing, could be just the ticket.
We aim to bring you long-term focused research analysis driven by fundamental data. Note that our analysis may not factor in the latest price-sensitive company announcements or qualitative material.
If you spot an error that warrants correction, please contact the editor at editorial-team@simplywallst.com. This article by Simply Wall St is general in nature. It does not constitute a recommendation to buy or sell any stock, and does not take account of your objectives, or your financial situation. Simply Wall St has no position in the stocks mentioned. Thank you for reading.

