What We Think Of Technofab Engineering Limited’s (NSE:TECHNOFAB) Investment Potential

Want to participate in a short research study? Help shape the future of investing tools and receive a $20 prize!
Today we are going to look at Technofab Engineering Limited (NSE:TECHNOFAB) to see whether it might be an attractive investment prospect. Specifically, we’ll consider its Return On Capital Employed (ROCE), since that will give us an insight into how efficiently the business can generate profits from the capital it requires.
Firstly, we’ll go over how we calculate ROCE. Then we’ll compare its ROCE to similar companies. And finally, we’ll look at how its current liabilities are impacting its ROCE.
Return On Capital Employed (ROCE): What is it?
ROCE measures the ‘return’ (pre-tax profit) a company generates from capital employed in its business. Generally speaking a higher ROCE is better. In brief, it is a useful tool, but it is not without drawbacks. Author Edwin Whiting says to be careful when comparing the ROCE of different businesses, since ‘No two businesses are exactly alike.’
How Do You Calculate Return On Capital Employed?
Analysts use this formula to calculate return on capital employed:
Return on Capital Employed = Earnings Before Interest and Tax (EBIT) ÷ (Total Assets – Current Liabilities)
Or for Technofab Engineering:
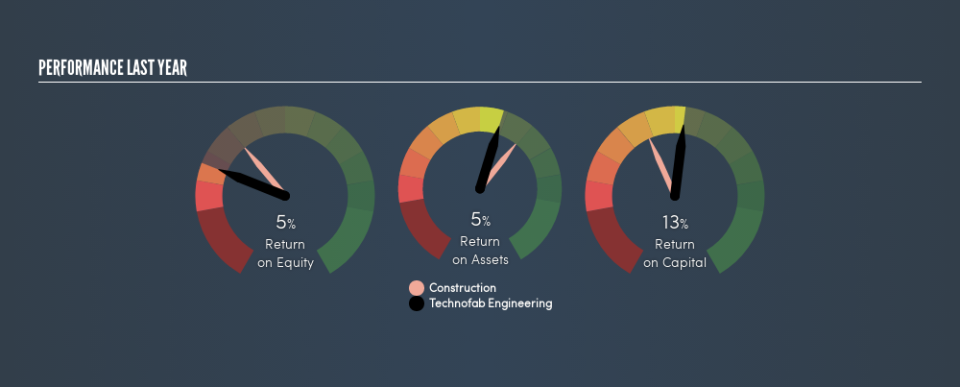
0.13 = ₹494m ÷ (₹7.0b – ₹3.1b) (Based on the trailing twelve months to March 2018.)
Therefore, Technofab Engineering has an ROCE of 13%.
See our latest analysis for Technofab Engineering
Is Technofab Engineering’s ROCE Good?
One way to assess ROCE is to compare similar companies. We can see Technofab Engineering’s ROCE is around the 12% average reported by the Construction industry. Separate from how Technofab Engineering stacks up against its industry, its ROCE in absolute terms is mediocre; relative to the returns on government bonds. Readers may find more attractive investment prospects elsewhere.
As we can see, Technofab Engineering currently has an ROCE of 13% compared to its ROCE 3 years ago, which was 9.1%. This makes us wonder if the company is improving.
When considering this metric, keep in mind that it is backwards looking, and not necessarily predictive. ROCE can be misleading for companies in cyclical industries, with returns looking impressive during the boom times, but very weak during the busts. ROCE is, after all, simply a snap shot of a single year. How cyclical is Technofab Engineering? You can see for yourself by looking at this free graph of past earnings, revenue and cash flow.
How Technofab Engineering’s Current Liabilities Impact Its ROCE
Current liabilities include invoices, such as supplier payments, short-term debt, or a tax bill, that need to be paid within 12 months. The ROCE equation subtracts current liabilities from capital employed, so a company with a lot of current liabilities appears to have less capital employed, and a higher ROCE than otherwise. To check the impact of this, we calculate if a company has high current liabilities relative to its total assets.
Technofab Engineering has total liabilities of ₹3.1b and total assets of ₹7.0b. Therefore its current liabilities are equivalent to approximately 45% of its total assets. Technofab Engineering’s middling level of current liabilities have the effect of boosting its ROCE a bit.
The Bottom Line On Technofab Engineering’s ROCE
Despite this, its ROCE is still mediocre, and you may find more appealing investments elsewhere. Of course you might be able to find a better stock than Technofab Engineering. So you may wish to see this free collection of other companies that have grown earnings strongly.
If you are like me, then you will not want to miss this free list of growing companies that insiders are buying.
We aim to bring you long-term focused research analysis driven by fundamental data. Note that our analysis may not factor in the latest price-sensitive company announcements or qualitative material.
If you spot an error that warrants correction, please contact the editor at editorial-team@simplywallst.com. This article by Simply Wall St is general in nature. It does not constitute a recommendation to buy or sell any stock, and does not take account of your objectives, or your financial situation. Simply Wall St has no position in the stocks mentioned. On rare occasion, data errors may occur. Thank you for reading.
