Those Who Purchased BPL (NSE:BPL) Shares A Year Ago Have A 65% Loss To Show For It

The nature of investing is that you win some, and you lose some. Anyone who held BPL Limited (NSE:BPL) over the last year knows what a loser feels like. The share price is down a hefty 65% in that time. At least the damage isn't so bad if you look at the last three years, since the stock is down 21% in that time. Furthermore, it's down 19% in about a quarter. That's not much fun for holders.
Want to participate in a short research study? Help shape the future of investing tools and you could win a $250 gift card!
View our latest analysis for BPL
BPL isn't a profitable company, so it is unlikely we'll see a strong correlation between its share price and its earnings per share (EPS). Arguably revenue is our next best option. Shareholders of unprofitable companies usually expect strong revenue growth. That's because fast revenue growth can be easily extrapolated to forecast profits, often of considerable size.
In the last year BPL saw its revenue grow by 6.3%. That's not a very high growth rate considering it doesn't make profits. Without profits, and with revenue growth sluggish, you get a 65% loss for shareholders, over the year. Like many holders, we really want to see better revenue growth in companies that lose money. Of course, the market can be too impatient at times. Why not take a closer look at this one so you're ready to pounce if growth does accelerate.
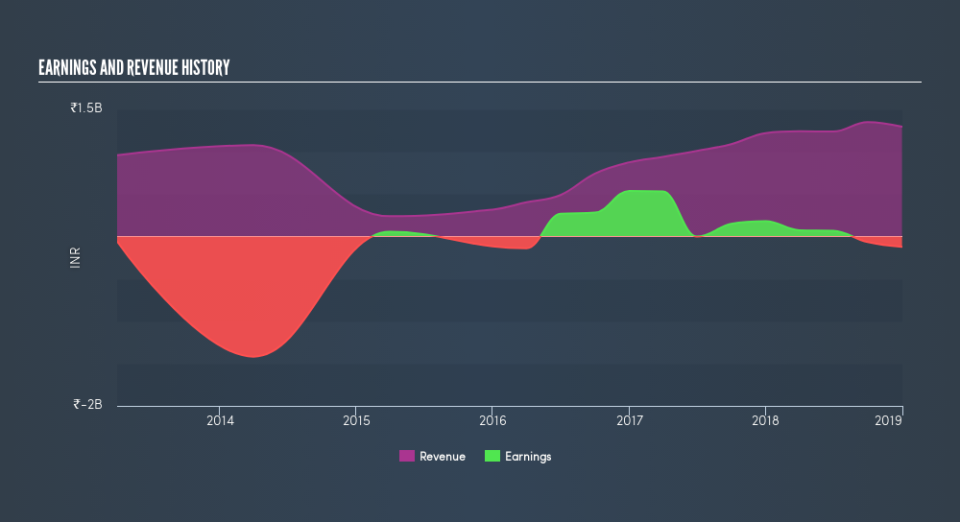
The chart below shows how revenue and earnings have changed with time, (if you click on the chart you can see the actual values).
This free interactive report on BPL's balance sheet strength is a great place to start, if you want to investigate the stock further.
A Different Perspective
Investors in BPL had a tough year, with a total loss of 65%, against a market gain of about 1.5%. Even the share prices of good stocks drop sometimes, but we want to see improvements in the fundamental metrics of a business, before getting too interested. On the bright side, long term shareholders have made money, with a gain of 1.9% per year over half a decade. If the fundamental data continues to indicate long term sustainable growth, the current sell-off could be an opportunity worth considering. Shareholders might want to examine this detailed historical graph of past earnings, revenue and cash flow.
If you are like me, then you will not want to miss this free list of growing companies that insiders are buying.
Please note, the market returns quoted in this article reflect the market weighted average returns of stocks that currently trade on IN exchanges.
We aim to bring you long-term focused research analysis driven by fundamental data. Note that our analysis may not factor in the latest price-sensitive company announcements or qualitative material.
If you spot an error that warrants correction, please contact the editor at editorial-team@simplywallst.com. This article by Simply Wall St is general in nature. It does not constitute a recommendation to buy or sell any stock, and does not take account of your objectives, or your financial situation. Simply Wall St has no position in the stocks mentioned. Thank you for reading.

