Those Who Purchased Indian Card Clothing (NSE:INDIANCARD) Shares Three Years Ago Have A 46% Loss To Show For It

The Indian Card Clothing Company Limited (NSE:INDIANCARD) shareholders should be happy to see the share price up 16% in the last quarter. But that doesn't change the fact that the returns over the last three years have been less than pleasing. After all, the share price is down 46% in the last three years, significantly under-performing the market.
Check out our latest analysis for Indian Card Clothing
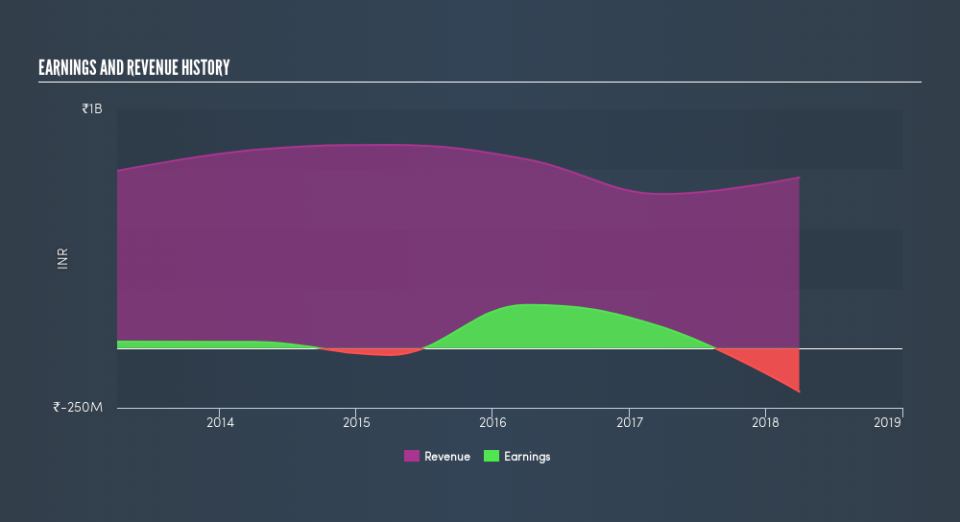
Indian Card Clothing isn't a profitable company, so it is unlikely we'll see a strong correlation between its share price and its earnings per share (EPS). Arguably revenue is our next best option. When a company doesn't make profits, we'd generally expect to see good revenue growth. That's because it's hard to be confident a company will be sustainable if revenue growth is negligible, and it never makes a profit.
The graphic below shows how revenue and earnings have changed as management guided the business forward. If you want to see cashflow, you can click on the chart.
You can see how its balance sheet has strengthened (or weakened) over time in this free interactive graphic.
A Dividend Lost
It's important to keep in mind that we've been talking about the share price returns, which don't include dividends, while the total shareholder return does. By accounting for the value of dividends paid, the TSR can be seen as a more complete measure of the value a company brings to its shareholders. Over the last 3 years, Indian Card Clothing generated a TSR of -39%, which is, of course, better than the share price return. Even though the company isn't paying dividends at the moment, it has done in the past.
A Different Perspective
Indian Card Clothing shareholders are down 25% for the year, but the market itself is up 0.9%. Even the share prices of good stocks drop sometimes, but we want to see improvements in the fundamental metrics of a business, before getting too interested. On the bright side, long term shareholders have made money, with a gain of 5.8% per year over half a decade. If the fundamental data continues to indicate long term sustainable growth, the current sell-off could be an opportunity worth considering. You could get a better understanding of Indian Card Clothing's growth by checking out this more detailed historical graph of earnings, revenue and cash flow.
Of course Indian Card Clothing may not be the best stock to buy. So you may wish to see this free collection of growth stocks.
Please note, the market returns quoted in this article reflect the market weighted average returns of stocks that currently trade on IN exchanges.
We aim to bring you long-term focused research analysis driven by fundamental data. Note that our analysis may not factor in the latest price-sensitive company announcements or qualitative material.
If you spot an error that warrants correction, please contact the editor at editorial-team@simplywallst.com. This article by Simply Wall St is general in nature. It does not constitute a recommendation to buy or sell any stock, and does not take account of your objectives, or your financial situation. Simply Wall St has no position in the stocks mentioned. Thank you for reading.

