Those Who Purchased Sipa Resources (ASX:SRI) Shares Five Years Ago Have A 88% Loss To Show For It

Long term investing works well, but it doesn't always work for each individual stock. It hits us in the gut when we see fellow investors suffer a loss. Spare a thought for those who held Sipa Resources Limited (ASX:SRI) for five whole years - as the share price tanked 88%. We also note that the stock has performed poorly over the last year, with the share price down 32%. On top of that, the share price has dropped a further 17% in a month.
While a drop like that is definitely a body blow, money isn't as important as health and happiness.
See our latest analysis for Sipa Resources
Sipa Resources recorded just AU$210,665 in revenue over the last twelve months, which isn't really enough for us to consider it to have a proven product. We can't help wondering why it's publicly listed so early in its journey. Are venture capitalists not interested? As a result, we think it's unlikely shareholders are paying much attention to current revenue, but rather speculating on growth in the years to come. It seems likely some shareholders believe that Sipa Resources will find or develop a valuable new mine before too long.
We think companies that have neither significant revenues nor profits are pretty high risk. There is almost always a chance they will need to raise more capital, and their progress - and share price - will dictate how dilutive that is to current holders. While some such companies go on to make revenue, profits, and generate value, others get hyped up by hopeful naifs before eventually going bankrupt. Some Sipa Resources investors have already had a taste of the bitterness stocks like this can leave in the mouth.
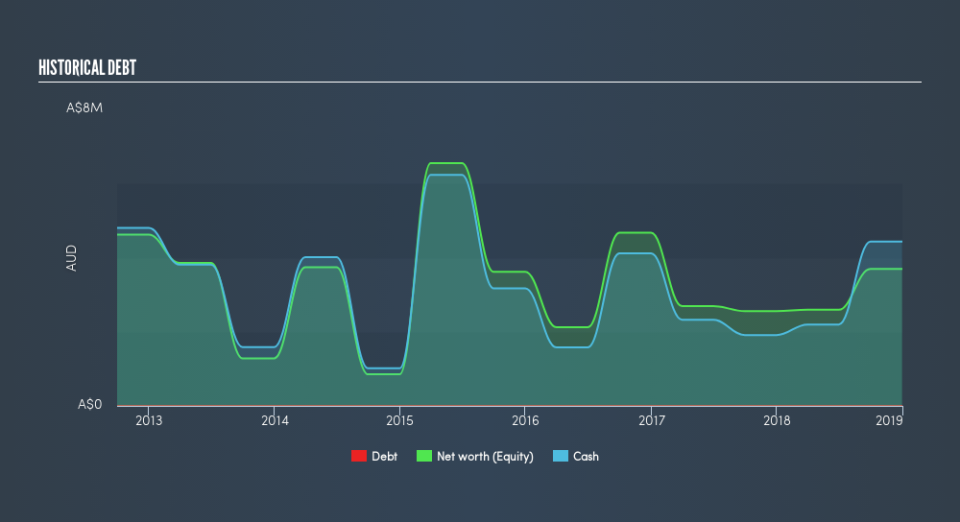
When it last reported its balance sheet in December 2018, Sipa Resources had cash in excess of all liabilities of AU$2.7m. While that's nothing to panic about, there is some possibility the company will raise more capital, especially if profits are not imminent. With the share price down 34% per year, over 5 years, it seems likely that the need for cash is weighing on investors' minds. You can click on the image below to see (in greater detail) how Sipa Resources's cash levels have changed over time. The image below shows how Sipa Resources's balance sheet has changed over time; if you want to see the precise values, simply click on the image.
In reality it's hard to have much certainty when valuing a business that has neither revenue or profit. Given that situation, would you be concerned if it turned out insiders were relentlessly selling stock? I would feel more nervous about the company if that were so. It costs nothing but a moment of your time to see if we are picking up on any insider selling.
A Different Perspective
Sipa Resources shareholders are down 32% for the year, but the market itself is up 13%. Even the share prices of good stocks drop sometimes, but we want to see improvements in the fundamental metrics of a business, before getting too interested. Unfortunately, longer term shareholders are suffering worse, given the loss of 34% doled out over the last five years. We would want clear information suggesting the company will grow, before taking the view that the share price will stabilize. You might want to assess this data-rich visualization of its earnings, revenue and cash flow.
We will like Sipa Resources better if we see some big insider buys. While we wait, check out this free list of growing companies with considerable, recent, insider buying.
Please note, the market returns quoted in this article reflect the market weighted average returns of stocks that currently trade on AU exchanges.
We aim to bring you long-term focused research analysis driven by fundamental data. Note that our analysis may not factor in the latest price-sensitive company announcements or qualitative material.
If you spot an error that warrants correction, please contact the editor at editorial-team@simplywallst.com. This article by Simply Wall St is general in nature. It does not constitute a recommendation to buy or sell any stock, and does not take account of your objectives, or your financial situation. Simply Wall St has no position in the stocks mentioned. Thank you for reading.
