Those Who Purchased Storm Real Estate (OB:STORM) Shares Five Years Ago Have A 97% Loss To Show For It

We're definitely into long term investing, but some companies are simply bad investments over any time frame. We really hate to see fellow investors lose their hard-earned money. Imagine if you held Storm Real Estate ASA (OB:STORM) for half a decade as the share price tanked 97%. And we doubt long term believers are the only worried holders, since the stock price has declined 35% over the last twelve months. Unfortunately the share price momentum is still quite negative, with prices down 19% in thirty days.
We really hope anyone holding through that price crash has a diversified portfolio. Even when you lose money, you don't have to lose the lesson.
Check out our latest analysis for Storm Real Estate
Storm Real Estate recorded just US$2,260,000 in revenue over the last twelve months, which isn't really enough for us to consider it to have a proven product. We can't help wondering why it's publicly listed so early in its journey. Are venture capitalists not interested? So it seems that the investors focused more on what could be, than paying attention to the current revenues (or lack thereof). Investors will be hoping that Storm Real Estate can make progress and gain better traction for the business, before it runs low on cash.
As a general rule, if a company doesn't have much revenue, and it loses money, then it is a high risk investment. You should be aware that there is always a chance that this sort of company will need to issue more shares to raise money to continue pursuing its business plan. While some companies like this go on to deliver on their plan, making good money for shareholders, many end in painful losses and eventual de-listing. It certainly is a dangerous place to invest, as Storm Real Estate investors might realise.
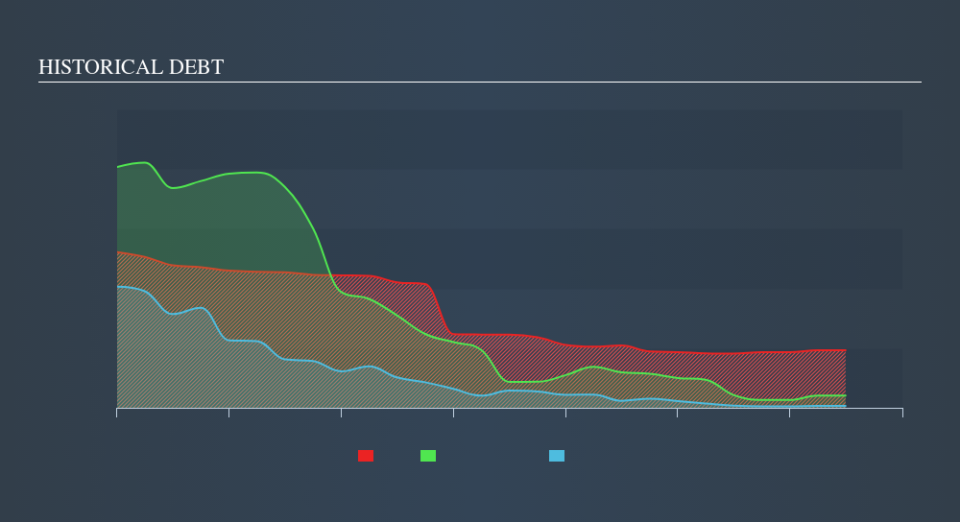
Storm Real Estate had liabilities exceeding cash by US$20m when it last reported in June 2019, according to our data. That puts it in the highest risk category, according to our analysis. But with the share price diving 52% per year, over 5 years , it's probably fair to say that some shareholders no longer believe the company will succeed. You can see in the image below, how Storm Real Estate's cash levels have changed over time (click to see the values). You can click on the image below to see (in greater detail) how Storm Real Estate's cash levels have changed over time.
Of course, the truth is that it is hard to value companies without much revenue or profit. Given that situation, would you be concerned if it turned out insiders were relentlessly selling stock? I'd like that just about as much as I like to drink milk and fruit juice mixed together. It costs nothing but a moment of your time to see if we are picking up on any insider selling.
What about the Total Shareholder Return (TSR)?
We've already covered Storm Real Estate's share price action, but we should also mention its total shareholder return (TSR). The TSR is a return calculation that accounts for the value of cash dividends (assuming that any dividend received was reinvested) and the calculated value of any discounted capital raisings and spin-offs. Storm Real Estate's TSR of was a loss of 86% for the 5 years. That wasn't as bad as its share price return, because it has paid dividends.
A Different Perspective
While the broader market gained around 0.6% in the last year, Storm Real Estate shareholders lost 35%. However, keep in mind that even the best stocks will sometimes underperform the market over a twelve month period. Unfortunately, last year's performance may indicate unresolved challenges, given that it was worse than the annualised loss of 33% over the last half decade. Generally speaking long term share price weakness can be a bad sign, though contrarian investors might want to research the stock in hope of a turnaround. You could get a better understanding of Storm Real Estate's growth by checking out this more detailed historical graph of earnings, revenue and cash flow.
If you are like me, then you will not want to miss this free list of growing companies that insiders are buying.
Please note, the market returns quoted in this article reflect the market weighted average returns of stocks that currently trade on NO exchanges.
We aim to bring you long-term focused research analysis driven by fundamental data. Note that our analysis may not factor in the latest price-sensitive company announcements or qualitative material.
If you spot an error that warrants correction, please contact the editor at editorial-team@simplywallst.com. This article by Simply Wall St is general in nature. It does not constitute a recommendation to buy or sell any stock, and does not take account of your objectives, or your financial situation. Simply Wall St has no position in the stocks mentioned. Thank you for reading.
