Three Key Risks For Bandhan Bank Limited (NSE:BANDHANBNK) You Should Know

Post-GFC recovery has led to improving credit quality and a strong growth environment for the banking sector. As a small-cap bank with a market capitalisation of ₹610b, Bandhan Bank Limited’s (NSE:BANDHANBNK) profit and value are directly affected by economic growth. This is because borrowers’ demand for, and ability to repay, their loans depend on the stability of their salaries and interest rates. Risk associated with repayment is measured by bad debt which is written off as an expense, impacting Bandhan Bank’s bottom line. Since the level of risky assets held by the bank impacts the attractiveness of it as an investment, I will take you through three metrics that are insightful proxies for risk.
See our latest analysis for Bandhan Bank
How Good Is Bandhan Bank At Forecasting Its Risks?
Bandhan Bank’s understanding of its risk level can be estimated by its ability to forecast and provision for its bad loans. If it writes off more than 100% of the bad debt it provisioned for, then it may have underestimated the risks that may have led to a higher bad loan level which begs the question – does Bandhan Bank understand its own risk? Bandhan Bank’s low non-performing loan allowance to non-performing loan ratio of 52.34% means the bank has under-provisioned by -47.66%, indicating either an unexpected one-off occurrence with defaults or poor bad debt provisioning. We do note though, that many banks don’t require 100% coverage of their non-performing loans, as banks often can seize collateral to cover their losses on bad loans.
How Much Risk Is Too Much?
Bandhan Bank is considered to be in better financial shape if it does not engage in overly risky lending practices. So what constitutes as overly risk? Ideally, loans that are “bad” and cannot be recuperated by the bank should comprise less than 3% of its total loans. Bad debt is written off as expenses when loans are not repaid which directly impacts Bandhan Bank’s bottom line. A ratio of 1.3% may indicate the bank faces relatively low chance of default and exhibits strong bad debt management – or it could indicate risks in the portfolio have not fully matured.
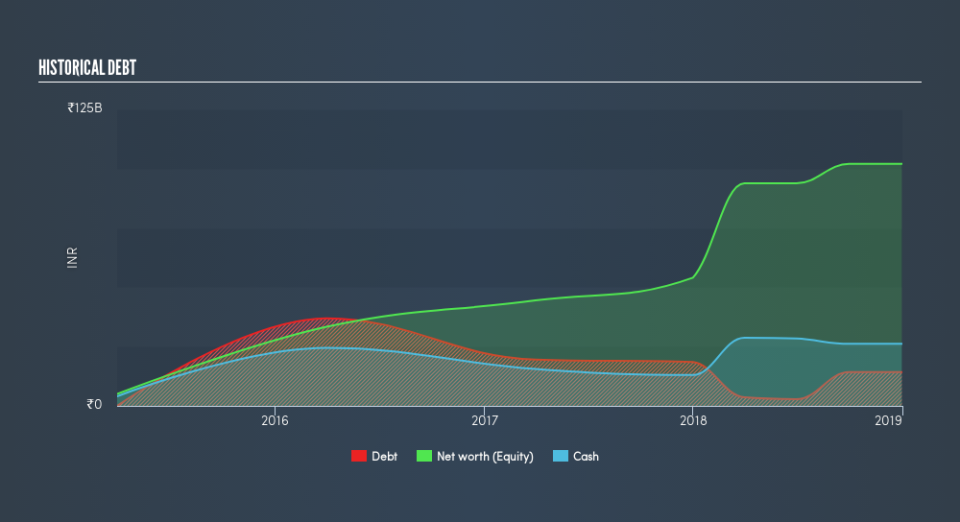
How Big Is Bandhan Bank’s Safety Net?

Bandhan Bank profits from lending out its various forms of borrowings and charging interest rates. Deposits from customers tend to carry the lowest risk due to the relatively stable interest rate and amount available. Generally, the higher level of deposits a bank retains, the less risky it is deemed to be. Bandhan Bank’s total deposit level of 93% of its total liabilities is very high and is well-above the sensible level of 50% for financial institutions. This may mean the bank is too cautious with its level of its safer form of borrowing and has plenty of headroom to take on risker forms of liability.
Next Steps:
BANDHANBNK’s acquisition will impact the business moving forward. Keep an eye on how this decision plays out in the future, especially on its financial health and earnings growth. Below, I’ve listed three fundamental areas on Simply Wall St’s dashboard for a quick visualization on current trends for BANDHANBNK. I’ve also used this site as a source of data for my article.
Future Outlook: What are well-informed industry analysts predicting for BANDHANBNK’s future growth? Take a look at our free research report of analyst consensus for BANDHANBNK’s outlook.
Valuation: What is BANDHANBNK worth today? Has the future growth potential already been factored into the price? The intrinsic value infographic in our free research report helps visualize whether BANDHANBNK is currently mispriced by the market.
Other High-Performing Stocks: Are there other stocks that provide better prospects with proven track records? Explore our free list of these great stocks here.
We aim to bring you long-term focused research analysis driven by fundamental data. Note that our analysis may not factor in the latest price-sensitive company announcements or qualitative material.
If you spot an error that warrants correction, please contact the editor at editorial-team@simplywallst.com. This article by Simply Wall St is general in nature. It does not constitute a recommendation to buy or sell any stock, and does not take account of your objectives, or your financial situation. Simply Wall St has no position in the stocks mentioned. Thank you for reading.
