Is Tian Teck Land Limited's (HKG:266) High P/E Ratio A Problem For Investors?

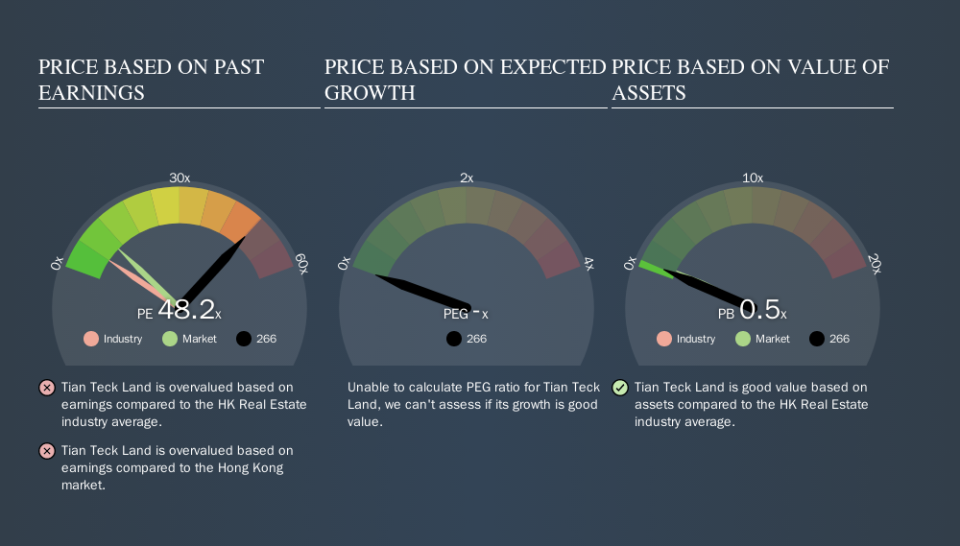
This article is written for those who want to get better at using price to earnings ratios (P/E ratios). To keep it practical, we'll show how Tian Teck Land Limited's (HKG:266) P/E ratio could help you assess the value on offer. Tian Teck Land has a price to earnings ratio of 48.20, based on the last twelve months. That is equivalent to an earnings yield of about 2.1%.
Check out our latest analysis for Tian Teck Land
How Do You Calculate A P/E Ratio?
The formula for price to earnings is:
Price to Earnings Ratio = Share Price ÷ Earnings per Share (EPS)
Or for Tian Teck Land:
P/E of 48.20 = HK$7.48 ÷ HK$0.16 (Based on the trailing twelve months to March 2019.)
Is A High Price-to-Earnings Ratio Good?
The higher the P/E ratio, the higher the price tag of a business, relative to its trailing earnings. All else being equal, it's better to pay a low price -- but as Warren Buffett said, 'It's far better to buy a wonderful company at a fair price than a fair company at a wonderful price.
How Does Tian Teck Land's P/E Ratio Compare To Its Peers?
One good way to get a quick read on what market participants expect of a company is to look at its P/E ratio. The image below shows that Tian Teck Land has a significantly higher P/E than the average (6.1) P/E for companies in the real estate industry.
That means that the market expects Tian Teck Land will outperform other companies in its industry. Clearly the market expects growth, but it isn't guaranteed. So investors should always consider the P/E ratio alongside other factors, such as whether company directors have been buying shares.
How Growth Rates Impact P/E Ratios
When earnings fall, the 'E' decreases, over time. That means unless the share price falls, the P/E will increase in a few years. So while a stock may look cheap based on past earnings, it could be expensive based on future earnings.
Tian Teck Land's earnings per share fell by 32% in the last twelve months. And EPS is down 37% a year, over the last 5 years. This could justify a pessimistic P/E.
Remember: P/E Ratios Don't Consider The Balance Sheet
One drawback of using a P/E ratio is that it considers market capitalization, but not the balance sheet. That means it doesn't take debt or cash into account. Hypothetically, a company could reduce its future P/E ratio by spending its cash (or taking on debt) to achieve higher earnings.
While growth expenditure doesn't always pay off, the point is that it is a good option to have; but one that the P/E ratio ignores.
How Does Tian Teck Land's Debt Impact Its P/E Ratio?
Tian Teck Land has net cash of HK$365m. This is fairly high at 10% of its market capitalization. That might mean balance sheet strength is important to the business, but should also help push the P/E a bit higher than it would otherwise be.
The Bottom Line On Tian Teck Land's P/E Ratio
Tian Teck Land has a P/E of 48.2. That's significantly higher than the average in its market, which is 10.3. The recent drop in earnings per share would make some investors cautious, but the relatively strong balance sheet will allow the company time to invest in growth. Clearly, the high P/E indicates shareholders think it will!
Investors have an opportunity when market expectations about a stock are wrong. People often underestimate remarkable growth -- so investors can make money when fast growth is not fully appreciated. We don't have analyst forecasts, but shareholders might want to examine this detailed historical graph of earnings, revenue and cash flow.
But note: Tian Teck Land may not be the best stock to buy. So take a peek at this free list of interesting companies with strong recent earnings growth (and a P/E ratio below 20).
We aim to bring you long-term focused research analysis driven by fundamental data. Note that our analysis may not factor in the latest price-sensitive company announcements or qualitative material.
If you spot an error that warrants correction, please contact the editor at editorial-team@simplywallst.com. This article by Simply Wall St is general in nature. It does not constitute a recommendation to buy or sell any stock, and does not take account of your objectives, or your financial situation. Simply Wall St has no position in the stocks mentioned. Thank you for reading.

