The TJX Companies, Inc. (NYSE:TJX): Time For A Financial Health Check

Want to participate in a short research study? Help shape the future of investing tools and you could win a $250 gift card!
The TJX Companies, Inc. (NYSE:TJX), a large-cap worth US$66b, comes to mind for investors seeking a strong and reliable stock investment. Risk-averse investors who are attracted to diversified streams of revenue and strong capital returns tend to seek out these large companies. But, the key to their continued success lies in its financial health. Let’s take a look at TJX Companies’s leverage and assess its financial strength to get an idea of their ability to fund strategic acquisitions and grow through cyclical pressures. Remember this is a very top-level look that focuses exclusively on financial health, so I recommend a deeper analysis into TJX here.
View our latest analysis for TJX Companies
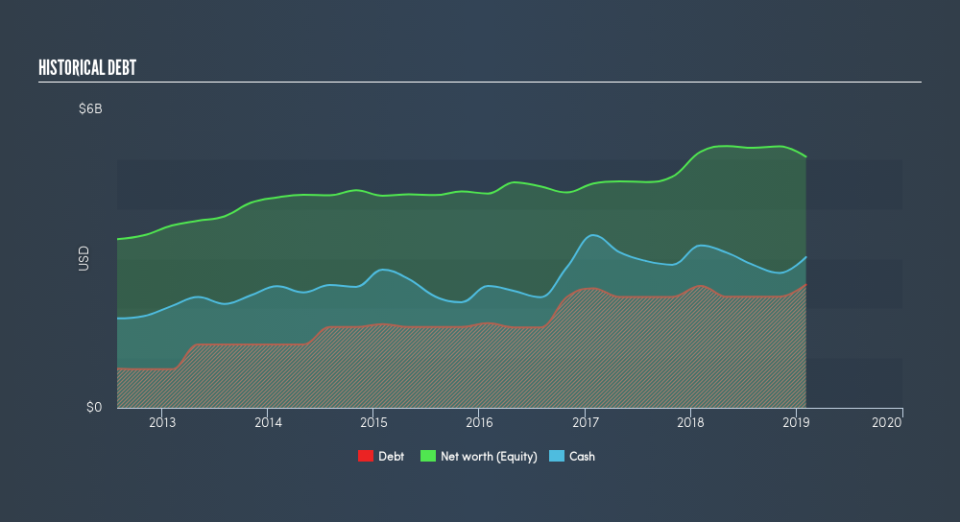
TJX’s Debt (And Cash Flows)
TJX has sustained its debt level by about US$2.5b over the last 12 months including long-term debt. At this constant level of debt, the current cash and short-term investment levels stands at US$3.0b , ready to be used for running the business. On top of this, TJX has generated cash from operations of US$4.1b in the last twelve months, resulting in an operating cash to total debt ratio of 165%, indicating that TJX’s debt is appropriately covered by operating cash.
Can TJX meet its short-term obligations with the cash in hand?
Looking at TJX’s US$5.5b in current liabilities, it seems that the business has been able to meet these commitments with a current assets level of US$8.5b, leading to a 1.53x current account ratio. The current ratio is calculated by dividing current assets by current liabilities. Usually, for Specialty Retail companies, this is a suitable ratio since there's a sufficient cash cushion without leaving too much capital idle or in low-earning investments.
Does TJX face the risk of succumbing to its debt-load?
TJX is a relatively highly levered company with a debt-to-equity of 49%. This is common amongst large-cap companies because debt can often be a less expensive alternative to equity due to tax deductibility of interest payments. Consequently, larger-cap organisations tend to enjoy lower cost of capital as a result of easily attained financing, providing an advantage over smaller companies. We can test if TJX’s debt levels are sustainable by measuring interest payments against earnings of a company. As a rule of thumb, a company should have earnings before interest and tax (EBIT) of at least three times the size of net interest. For TJX, the ratio of 476x suggests that interest is comfortably covered. It is considered a responsible and reassuring practice to maintain high interest coverage, which makes TJX and other large-cap investments thought to be safe.
Next Steps:
Although TJX’s debt level is towards the higher end of the spectrum, its cash flow coverage seems adequate to meet obligations which means its debt is being efficiently utilised. Since there is also no concerns around TJX's liquidity needs, this may be its optimal capital structure for the time being. Keep in mind I haven't considered other factors such as how TJX has been performing in the past. I suggest you continue to research TJX Companies to get a better picture of the large-cap by looking at:
Future Outlook: What are well-informed industry analysts predicting for TJX’s future growth? Take a look at our free research report of analyst consensus for TJX’s outlook.
Valuation: What is TJX worth today? Is the stock undervalued, even when its growth outlook is factored into its intrinsic value? The intrinsic value infographic in our free research report helps visualize whether TJX is currently mispriced by the market.
Other High-Performing Stocks: Are there other stocks that provide better prospects with proven track records? Explore our free list of these great stocks here.
We aim to bring you long-term focused research analysis driven by fundamental data. Note that our analysis may not factor in the latest price-sensitive company announcements or qualitative material.
If you spot an error that warrants correction, please contact the editor at editorial-team@simplywallst.com. This article by Simply Wall St is general in nature. It does not constitute a recommendation to buy or sell any stock, and does not take account of your objectives, or your financial situation. Simply Wall St has no position in the stocks mentioned. Thank you for reading.
