Is Trainers’ House Oyj's (HEL:TRH1V) P/E Ratio Really That Good?

The goal of this article is to teach you how to use price to earnings ratios (P/E ratios). We'll apply a basic P/E ratio analysis to Trainers’ House Oyj's (HEL:TRH1V), to help you decide if the stock is worth further research. What is Trainers’ House Oyj's P/E ratio? Well, based on the last twelve months it is 6.13. That is equivalent to an earnings yield of about 16.3%.
See our latest analysis for Trainers’ House Oyj
How Do I Calculate A Price To Earnings Ratio?
The formula for P/E is:
Price to Earnings Ratio = Price per Share ÷ Earnings per Share (EPS)
Or for Trainers’ House Oyj:
P/E of 6.13 = €0.31 ÷ €0.05 (Based on the trailing twelve months to September 2019.)
Is A High Price-to-Earnings Ratio Good?
A higher P/E ratio implies that investors pay a higher price for the earning power of the business. That isn't a good or a bad thing on its own, but a high P/E means that buyers have a higher opinion of the business's prospects, relative to stocks with a lower P/E.
Does Trainers’ House Oyj Have A Relatively High Or Low P/E For Its Industry?
The P/E ratio indicates whether the market has higher or lower expectations of a company. We can see in the image below that the average P/E (36.7) for companies in the professional services industry is higher than Trainers’ House Oyj's P/E.
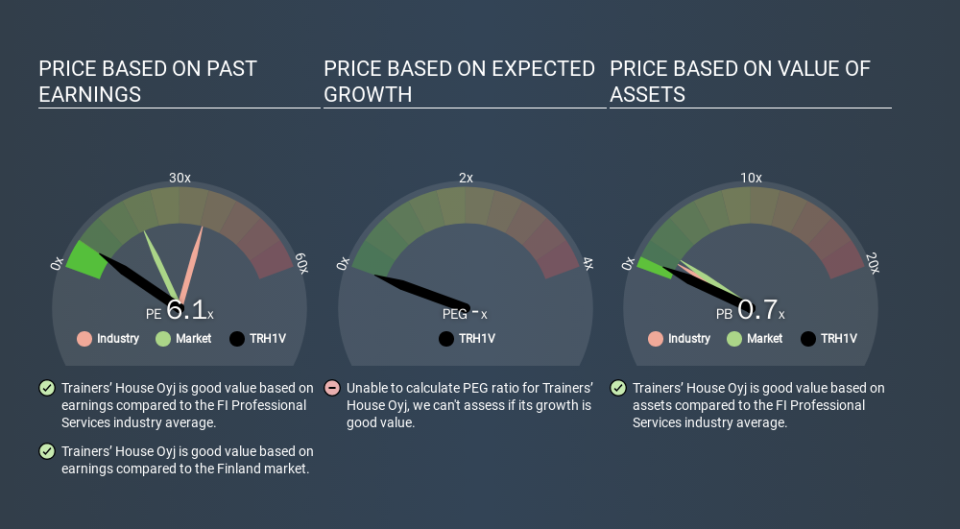
This suggests that market participants think Trainers’ House Oyj will underperform other companies in its industry. Since the market seems unimpressed with Trainers’ House Oyj, it's quite possible it could surprise on the upside. You should delve deeper. I like to check if company insiders have been buying or selling.
How Growth Rates Impact P/E Ratios
Earnings growth rates have a big influence on P/E ratios. If earnings are growing quickly, then the 'E' in the equation will increase faster than it would otherwise. That means unless the share price increases, the P/E will reduce in a few years. Then, a lower P/E should attract more buyers, pushing the share price up.
In the last year, Trainers’ House Oyj grew EPS like Taylor Swift grew her fan base back in 2010; the 102% gain was both fast and well deserved.
Don't Forget: The P/E Does Not Account For Debt or Bank Deposits
Don't forget that the P/E ratio considers market capitalization. Thus, the metric does not reflect cash or debt held by the company. In theory, a company can lower its future P/E ratio by using cash or debt to invest in growth.
Such expenditure might be good or bad, in the long term, but the point here is that the balance sheet is not reflected by this ratio.
How Does Trainers’ House Oyj's Debt Impact Its P/E Ratio?
Trainers’ House Oyj has net cash of €2.0m. This is fairly high at 28% of its market capitalization. That might mean balance sheet strength is important to the business, but should also help push the P/E a bit higher than it would otherwise be.
The Bottom Line On Trainers’ House Oyj's P/E Ratio
Trainers’ House Oyj's P/E is 6.1 which is below average (19.4) in the FI market. The net cash position gives plenty of options to the business, and the recent improvement in EPS is good to see. One might conclude that the market is a bit pessimistic, given the low P/E ratio.
When the market is wrong about a stock, it gives savvy investors an opportunity. If the reality for a company is not as bad as the P/E ratio indicates, then the share price should increase as the market realizes this. Although we don't have analyst forecasts you might want to assess this data-rich visualization of earnings, revenue and cash flow.
Of course, you might find a fantastic investment by looking at a few good candidates. So take a peek at this free list of companies with modest (or no) debt, trading on a P/E below 20.
If you spot an error that warrants correction, please contact the editor at editorial-team@simplywallst.com. This article by Simply Wall St is general in nature. It does not constitute a recommendation to buy or sell any stock, and does not take account of your objectives, or your financial situation. Simply Wall St has no position in the stocks mentioned.
We aim to bring you long-term focused research analysis driven by fundamental data. Note that our analysis may not factor in the latest price-sensitive company announcements or qualitative material. Thank you for reading.
