TrueCar and ALG Forecast Both New and Used Vehicle Retail Sales Up Year-Over-Year for October 2020 Marking Strong Auto Retail Recovery
TrueCar and ALG: Retail Sales Change (DSR)
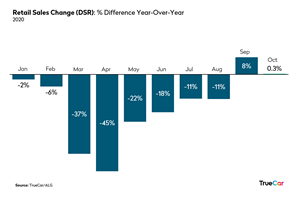
Retail Sales Change (DSR) % Difference Year-Over-Year 2020
New vehicle retail sales sustain momentum as retail sales increase year-over-year for the second month in a row, up 0.3% adjusted for selling days
Used vehicle sales forecast to be up year-over-year for fifth consecutive month
Average Transaction Prices are expected to increase 3.1% year-over-year
SANTA MONICA, Calif., Oct. 27, 2020 (GLOBE NEWSWIRE) -- TrueCar, Inc., and its ALG, Inc. subsidiary, project total new vehicle sales will reach 1,307,998 units in October 2020, down 6.1% from a year ago when adjusted for the same number of selling days. This month’s seasonally adjusted annualized rate (SAAR) for total light vehicle sales is an estimated 15.7 million units. Excluding fleet sales, TrueCar and ALG expect U.S. retail deliveries of new cars and light trucks to be 1,188,043 units, an increase of 0.3% from a year ago when adjusted for the same number of selling days.
Average transaction prices (ATP) are projected to be up 3.1% or $1,223 from a year ago and up 0.7% or $262 from September 2020. TrueCar projects that U.S. revenue from new vehicle sales will reach more than $48 billion for October 2020, up 0.4% (based on a non-adjusted daily selling rate) from a year ago and down 2.5% from last month.
“The auto industry recovery is absolutely striking. We clawed back more new car sales each month since sales bottomed out in April and are now seeing year-over-year new car retail sales growth for two consecutive months. This is a phenomenal outcome for the industry, as inventory is starting to rebound and demand remains high. There are positive signals that the recovery will sustain,” said Eric Lyman, Chief Industry Analyst for ALG.
“A handful of brands, such as Mercedes and Subaru, are seeing an increase in sales month-over-month which is notable given that sales typically trend stronger in September than in October,” added Lyman. “These brands were hit harder by inventory shortages previously and are starting to replenish supply and address pent up demand.”
Additional Insights: (Forecast by ALG and TrueCar)
Total retail sales for October 2020 are expected to be up 0.3% from a year ago and down 14.3% from September 2020 when adjusted for the same number of selling days.
Fleet sales for October 2020 are expected to be down 43% from a year ago and down 6% from September 2020 when adjusted for the same number of selling days.
Total SAAR is expected to decrease 5% from a year ago from 16.5 million units to 15.7 million units.
Used vehicle sales for October 2020 are expected to reach 3.3 million, up 1% from a year ago and down 4% from September 2020.
The average interest rates on new vehicles are 5.7% and the average interest rates on used vehicles are 8.1%.
“Domestic automakers such as FCA and GM have made significant jumps in retail sales year-over-year, as shoppers continue purchasing large utility vehicles and trucks,” said Nick Woolard, Director of OEM Analytics at TrueCar. “There was a 5.4% increase in demand for utility vehicles and an increase of 8.4% in demand for pickup trucks year-over-year on the TrueCar platform.”
“New vehicle average transaction prices continue to rise year-over-year due to this consumer preference toward larger vehicles. Used vehicle prices have also increased significantly in the past few months, as a result of the new car inventory shortages and strong consumer demand,” added Woolard. “On the TrueCar platform, used vehicle listing prices increased by 7.6% year over year, making this a great time for consumers who are looking to trade-in or sell their vehicles and use the funds to upgrade to a new vehicle.”
ALG will be hosting the 20/20 Hindsight webinar on November 17, 2020 at 11 am PT. Join us as we will look back on 2020 with a review of how the outlook for the automotive industry has evolved since the early stages of COVID-19. Experts will discuss key learnings, the decisions that improved performance or made things worse, while leaning into the data points that are leading to a more optimistic recovery and ensuring that 2021 is a rebound year for all stakeholders in the industry. For early registration of this complimentary webinar, click here.
October 2020 forecasts for the 13 largest manufacturers by volume. For additional data visit the ALG Newsroom and TrueCar Newsroom.
Total Unit Sales
Manufacturer | Oct 2020 Forecast | Oct 2019 Actual | Sep 2020 Actual | YoY % Change | YoY % Change | MoM % Change | MoM % Change | ||||
BMW | 26,131 | 28,518 | 31,031 | -8.4 | % | -11.6 | % | -15.8 | % | -24.8 | % |
Daimler | 22,834 | 32,130 | 22,052 | -28.9 | % | -31.5 | % | 3.5 | % | -7.5 | % |
FCA | 159,268 | 177,120 | 178,807 | -10.1 | % | -13.3 | % | -10.9 | % | -20.5 | % |
Ford | 187,646 | 193,571 | 189,375 | -3.1 | % | -6.5 | % | -0.9 | % | -11.5 | % |
GM | 228,122 | 209,870 | 238,542 | 8.7 | % | 4.8 | % | -4.4 | % | -14.6 | % |
Honda | 127,531 | 131,443 | 127,058 | -3.0 | % | -6.4 | % | 0.4 | % | -10.4 | % |
Hyundai | 53,322 | 59,029 | 55,918 | -9.7 | % | -12.9 | % | -4.6 | % | -14.9 | % |
Kia | 51,972 | 50,007 | 55,519 | 3.9 | % | 0.2 | % | -6.4 | % | -16.4 | % |
Nissan | 75,134 | 103,563 | 73,854 | -27.5 | % | -30.0 | % | 1.7 | % | -9.2 | % |
Subaru | 61,096 | 55,531 | 60,103 | 10.0 | % | 6.1 | % | 1.7 | % | -9.2 | % |
Tesla | 19,073 | 14,000 | 20,900 | 36.2 | % | 31.4 | % | -8.7 | % | -18.5 | % |
Toyota | 199,767 | 188,787 | 199,126 | 5.8 | % | 2.0 | % | 0.3 | % | -10.4 | % |
Volkswagen Group | 49,904 | 53,067 | 50,482 | -6.0 | % | -9.3 | % | -1.1 | % | -11.7 | % |
Industry | 1,307,998 | 1,343,842 | 1,351,643 | -2.7 | % | -6.1 | % | -3.2 | % | -13.6 | % |
Retail Unit Sales
Manufacturer | Oct 2020 Forecast | Oct 2019 Actual | Sep 2020 Actual | YoY % Change | YoY % Change | MoM % Change | MoM % Change | ||||
BMW | 25,312 | 25,365 | 29,810 | -0.2 | % | -3.8 | % | -15.1 | % | -24.2 | % |
Daimler | 22,195 | 28,936 | 21,333 | -23.3 | % | -26.0 | % | 4.0 | % | -7.1 | % |
FCA | 139,994 | 131,397 | 150,953 | 6.5 | % | 2.7 | % | -7.3 | % | -17.2 | % |
Ford | 147,250 | 143,098 | 149,144 | 2.9 | % | -0.8 | % | -1.3 | % | -11.8 | % |
GM | 198,479 | 180,840 | 210,463 | 9.8 | % | 5.8 | % | -5.7 | % | -15.8 | % |
Honda | 126,943 | 130,268 | 126,527 | -2.6 | % | -6.0 | % | 0.3 | % | -10.4 | % |
Hyundai | 50,178 | 46,533 | 53,135 | 7.8 | % | 4.0 | % | -5.6 | % | -15.7 | % |
Kia | 50,488 | 43,262 | 54,346 | 16.7 | % | 12.5 | % | -7.1 | % | -17.1 | % |
Nissan | 69,570 | 71,779 | 71,138 | -3.1 | % | -6.5 | % | -2.2 | % | -12.7 | % |
Subaru | 59,904 | 54,112 | 59,173 | 10.7 | % | 6.8 | % | 1.2 | % | -9.6 | % |
Tesla | 19,061 | 14,000 | 20,890 | 36.1 | % | 31.3 | % | -8.8 | % | -18.5 | % |
Toyota | 184,891 | 176,689 | 192,565 | 4.6 | % | 0.9 | % | -4.0 | % | -14.3 | % |
Volkswagen Group | 49,702 | 52,400 | 50,274 | -5.1 | % | -8.5 | % | -1.1 | % | -11.7 | % |
Industry | 1,188,043 | 1,141,863 | 1,237,638 | 4.0 | % | 0.3 | % | -4.0 | % | -14.3 | % |
Fleet Unit Sales
Manufacturer | Oct 2020 Forecast | Oct 2019 Actual | Sep 2020 Actual | YoY % Change | YoY % Change | MoM % Change | MoM % Change | ||||
BMW | 820 | 3,153 | 1,221 | -74.0 | % | -74.9 | % | -32.9 | % | -40.1 | % |
Daimler | 639 | 3,194 | 719 | -80.0 | % | -80.7 | % | -11.1 | % | -20.6 | % |
FCA | 19,275 | 45,723 | 27,854 | -57.8 | % | -59.4 | % | -30.8 | % | -38.2 | % |
Ford | 40,396 | 50,473 | 40,231 | -20.0 | % | -22.8 | % | 0.4 | % | -10.3 | % |
GM | 29,643 | 29,030 | 28,079 | 2.1 | % | -1.5 | % | 5.6 | % | -5.7 | % |
Honda | 588 | 1,175 | 531 | -50.0 | % | -51.8 | % | 10.7 | % | -1.2 | % |
Hyundai | 3,144 | 12,496 | 2,783 | -74.8 | % | -75.7 | % | 13.0 | % | 0.9 | % |
Kia | 1,484 | 6,745 | 1,173 | -78.0 | % | -78.8 | % | 26.5 | % | 13.0 | % |
Nissan | 5,564 | 31,784 | 2,716 | -82.5 | % | -83.1 | % | 104.8 | % | 82.9 | % |
Subaru | 1,192 | 1,419 | 930 | -16.0 | % | -19.0 | % | 28.2 | % | 14.5 | % |
Tesla | 12 | - | 10 | - | - | 14.4 | % | 2.1 | % | ||
Toyota | 14,877 | 12,098 | 6,561 | 23.0 | % | 18.6 | % | 126.8 | % | 102.5 | % |
Volkswagen Group | 202 | 667 | 208 | -69.7 | % | -70.8 | % | -2.8 | % | -13.2 | % |
Industry | 119,955 | 201,979 | 114,005 | -40.6 | % | -42.7 | % | 5.2 | % | -6.1 | % |
Fleet Penetration
Manufacturer | Oct 2020 Forecast | Oct 2019 Actual | Sep 2020 Actual | YoY % Change | MoM % Change | |||||
BMW | 3.1 | % | 11.1 | % | 3.9 | % | -71.6 | % | -20.3 | % |
Daimler | 2.8 | % | 9.9 | % | 3.3 | % | -71.9 | % | -14.2 | % |
FCA | 12.1 | % | 25.8 | % | 15.6 | % | -53.1 | % | -22.3 | % |
Ford | 21.5 | % | 26.1 | % | 21.2 | % | -17.4 | % | 1.3 | % |
GM | 13.0 | % | 13.8 | % | 11.8 | % | -6.1 | % | 10.4 | % |
Honda | 0.5 | % | 0.9 | % | 0.4 | % | -48.5 | % | 10.3 | % |
Hyundai | 5.9 | % | 21.2 | % | 5.0 | % | -72.1 | % | 18.5 | % |
Kia | 2.9 | % | 13.5 | % | 2.1 | % | -78.8 | % | 35.2 | % |
Nissan | 7.4 | % | 30.7 | % | 3.7 | % | -75.9 | % | 101.3 | % |
Subaru | 2.0 | % | 2.6 | % | 1.5 | % | -23.7 | % | 26.1 | % |
Tesla | 0.1 | % | 0.0 | % | 0.1 | % | - | 25.3 | % | |
Toyota | 7.4 | % | 6.4 | % | 3.3 | % | 16.2 | % | 126.0 | % |
Volkswagen Group | 0.4 | % | 1.3 | % | 0.4 | % | -67.8 | % | -1.7 | % |
Industry | 9.2 | % | 15.0 | % | 8.4 | % | -39.0 | % | 8.7 | % |
Total Market Share
Manufacturer | Oct 2020 Forecast | Oct 2019 Actual | Sep 2020 Actual | |||
BMW | 2.0 | % | 2.1 | % | 2.3 | % |
Daimler | 1.7 | % | 2.4 | % | 1.6 | % |
FCA | 12.2 | % | 13.2 | % | 13.2 | % |
Ford | 14.3 | % | 14.4 | % | 14.0 | % |
GM | 17.4 | % | 15.6 | % | 17.6 | % |
Honda | 9.8 | % | 9.8 | % | 9.4 | % |
Hyundai | 4.1 | % | 4.4 | % | 4.1 | % |
Kia | 4.0 | % | 3.7 | % | 4.1 | % |
Nissan | 5.7 | % | 7.7 | % | 5.5 | % |
Subaru | 4.7 | % | 4.1 | % | 4.4 | % |
Tesla | 1.5 | % | 1.0 | % | 1.5 | % |
Toyota | 15.3 | % | 14.0 | % | 14.7 | % |
Volkswagen Group | 3.8 | % | 3.9 | % | 3.7 | % |
Retail Market Share
Manufacturer | Oct 2020 Forecast | Oct 2019 Actual | Sep 2020 Actual | |||
BMW | 2.1 | % | 2.2 | % | 2.4 | % |
Daimler | 1.9 | % | 2.5 | % | 1.7 | % |
FCA | 11.8 | % | 11.5 | % | 12.2 | % |
Ford | 12.4 | % | 12.5 | % | 12.1 | % |
GM | 16.7 | % | 15.8 | % | 17.0 | % |
Honda | 10.7 | % | 11.4 | % | 10.2 | % |
Hyundai | 4.2 | % | 4.1 | % | 4.3 | % |
Kia | 4.2 | % | 3.8 | % | 4.4 | % |
Nissan | 5.9 | % | 6.3 | % | 5.7 | % |
Subaru | 5.0 | % | 4.7 | % | 4.8 | % |
Tesla | 1.6 | % | 1.2 | % | 1.7 | % |
Toyota | 15.6 | % | 15.5 | % | 15.6 | % |
Volkswagen Group | 4.2 | % | 4.6 | % | 4.1 | % |
Average Transaction Price (ATP)
Manufacturer | Oct 2020 Forecast | Oct 2019 Actual | Sep 2020 Actual | YOY | MOM | |||||
BMW | $ | 60,309 | $ | 57,413 | $ | 59,012 | 5.0 | % | 2.2 | % |
Daimler | $ | 58,080 | $ | 57,749 | $ | 58,474 | 0.6 | % | -0.7 | % |
FCA | $ | 43,200 | $ | 40,400 | $ | 42,679 | 6.9 | % | 1.2 | % |
Ford | $ | 43,521 | $ | 41,116 | $ | 43,297 | 5.8 | % | 0.5 | % |
GM | $ | 42,867 | $ | 41,441 | $ | 42,134 | 3.4 | % | 1.7 | % |
Honda | $ | 30,398 | $ | 29,370 | $ | 30,379 | 3.5 | % | 0.1 | % |
Hyundai | $ | 28,922 | $ | 26,184 | $ | 28,762 | 10.5 | % | 0.6 | % |
Kia | $ | 27,701 | $ | 26,094 | $ | 27,021 | 6.2 | % | 2.5 | % |
Nissan | $ | 29,144 | $ | 29,359 | $ | 29,149 | -0.7 | % | 0.0 | % |
Subaru | $ | 30,193 | $ | 29,907 | $ | 29,976 | 1.0 | % | 0.7 | % |
Toyota | $ | 34,816 | $ | 33,273 | $ | 33,842 | 4.6 | % | 2.9 | % |
Volkswagen Group | $ | 41,772 | $ | 39,592 | $ | 41,107 | 5.5 | % | 1.6 | % |
Industry | $ | 37,018 | $ | 35,895 | $ | 36,756 | 3.1 | % | 0.7 | % |
Incentive Spending
Manufacturer | Oct 2020 Forecast | Oct 2019 Actual | Sep 2020 Actual | YOY | MOM | ||||||
BMW | $ | 5,049 | $ | 6,038 | $ | 5,859 | -16.4 | % | -13.8 | % | |
Daimler | $ | 5,187 | $ | 5,369 | $ | 5,675 | -3.4 | % | -8.6 | % | |
FCA | $ | 4,875 | $ | 4,906 | $ | 5,063 | -0.6 | % | -3.7 | % | |
Ford | $ | 4,355 | $ | 4,604 | $ | 4,301 | -5.4 | % | 1.3 | % | |
GM | $ | 5,254 | $ | 5,115 | $ | 5,667 | 2.7 | % | -7.3 | % | |
Honda | $ | 2,663 | $ | 2,040 | $ | 2,624 | 30.5 | % | 1.5 | % | |
Hyundai | $ | 2,682 | $ | 2,749 | $ | 2,486 | -2.4 | % | 7.9 | % | |
Kia | $ | 2,863 | $ | 3,541 | $ | 3,779 | -19.1 | % | -24.2 | % | |
Nissan | $ | 4,487 | $ | 3,927 | $ | 4,792 | 14.3 | % | -6.4 | % | |
Subaru | $ | 1,781 | $ | 1,454 | $ | 1,747 | 22.5 | % | 1.9 | % | |
Toyota | $ | 2,637 | $ | 2,444 | $ | 2,644 | 7.9 | % | -0.3 | % | |
Volkswagen Group | $ | 3,802 | $ | 3,493 | $ | 4,336 | 8.9 | % | -12.3 | % | |
Industry | $ | 3,869 | $ | 3,772 | $ | 4,083 | 2.6 | % | -5.2 | % | |
Incentives as a Percentage of Average Transaction Price (ATP)
Manufacturer | Oct 2020 Forecast | Oct 2019 Actual | Sep 2020 Actual | YOY | MOM | ||||||
BMW | 8.4 | % | 10.5 | % | 9.9 | % | -20.4 | % | -15.7 | % | |
Daimler | 8.9 | % | 9.3 | % | 9.7 | % | -3.9 | % | -8.0 | % | |
FCA | 11.3 | % | 12.1 | % | 11.9 | % | -7.1 | % | -4.9 | % | |
Ford | 10.0 | % | 11.2 | % | 9.9 | % | -10.6 | % | 0.7 | % | |
GM | 12.3 | % | 12.3 | % | 13.5 | % | -0.7 | % | -8.9 | % | |
Honda | 8.8 | % | 6.9 | % | 8.6 | % | 26.1 | % | 1.4 | % | |
Hyundai | 9.3 | % | 10.5 | % | 8.6 | % | -11.7 | % | 7.3 | % | |
Kia | 10.3 | % | 13.6 | % | 14.0 | % | -23.8 | % | -26.1 | % | |
Nissan | 15.4 | % | 13.4 | % | 16.4 | % | 15.1 | % | -6.3 | % | |
Subaru | 5.9 | % | 4.9 | % | 5.8 | % | 21.3 | % | 1.2 | % | |
Toyota | 7.6 | % | 7.3 | % | 7.8 | % | 3.1 | % | -3.0 | % | |
Volkswagen Group | 9.1 | % | 8.8 | % | 10.5 | % | 3.2 | % | -13.7 | % | |
Industry | 10.5 | % | 10.5 | % | 11.1 | % | -0.5 | % | -5.9 | % | |
(Note: This forecast is based solely on ALG's analysis of industry sales trends and conditions and is not a projection of TrueCar, Inc.’s operations.)
About ALG
Founded in 1964 and headquartered in Santa Monica, California, ALG is an industry authority on automotive residual value projections in both the United States and Canada. By analyzing nearly 2,500 vehicle trims each year to assess residual value, ALG provides auto industry and financial services clients with market industry insights, residual value forecasts, consulting and vehicle portfolio management and risk services. ALG is a wholly-owned subsidiary of TrueCar, Inc., a digital automotive marketplace that provides comprehensive pricing transparency about what other people paid for their cars. ALG has been publishing residual values for all cars, trucks and SUVs in the U.S. for over 55 years and in Canada since 1981.
About TrueCar
TrueCar is a leading automotive digital marketplace that enables car buyers to connect to our nationwide network of Certified Dealers. We are building the industry's most personalized and efficient car buying experience as we seek to bring more of the purchasing process online. Consumers who visit our marketplace will find a suite of vehicle discovery tools, price ratings and market context on new and used cars -- all with a clear view of what's a great deal. When they are ready, TrueCar will enable them to connect with a local Certified Dealer who shares in our belief that truth, transparency and fairness are the foundation of a great car buying experience. As part of our marketplace, TrueCar powers car-buying programs for over 250 leading brands, including AARP, Sam’s Club, and American Express. Nearly half of all new-car buyers engage with TrueCar powered sites, where they buy smarter and drive happier. TrueCar is headquartered in Santa Monica, California, with offices in Austin, Texas and Boston, Massachusetts.
For more information, please visit www.truecar.com, and follow us on Facebook or Twitter. TrueCar media line: +1-844-469-8442 (US toll-free) | Email: pr@truecar.com
A photo accompanying this announcement is available at https://www.globenewswire.com/NewsRoom/AttachmentNg/bad62bf8-879d-462c-9389-398cd8645153
CONTACT: TrueCar and ALG PR Contact: Shadee Malekafzali shadee@truecar.com 424.258.8694
