Is Twin Disc, Incorporated's (NASDAQ:TWIN) P/E Ratio Really That Good?

Want to participate in a short research study? Help shape the future of investing tools and you could win a $250 gift card!
This article is written for those who want to get better at using price to earnings ratios (P/E ratios). We'll look at Twin Disc, Incorporated's (NASDAQ:TWIN) P/E ratio and reflect on what it tells us about the company's share price. What is Twin Disc's P/E ratio? Well, based on the last twelve months it is 10.17. That is equivalent to an earnings yield of about 9.8%.
See our latest analysis for Twin Disc
How Do You Calculate A P/E Ratio?
The formula for price to earnings is:
Price to Earnings Ratio = Price per Share ÷ Earnings per Share (EPS)
Or for Twin Disc:
P/E of 10.17 = $14.33 ÷ $1.41 (Based on the year to March 2019.)
Is A High Price-to-Earnings Ratio Good?
A higher P/E ratio means that buyers have to pay a higher price for each $1 the company has earned over the last year. That isn't a good or a bad thing on its own, but a high P/E means that buyers have a higher opinion of the business's prospects, relative to stocks with a lower P/E.
How Growth Rates Impact P/E Ratios
Generally speaking the rate of earnings growth has a profound impact on a company's P/E multiple. If earnings are growing quickly, then the 'E' in the equation will increase faster than it would otherwise. And in that case, the P/E ratio itself will drop rather quickly. So while a stock may look expensive based on past earnings, it could be cheap based on future earnings.
In the last year, Twin Disc grew EPS like Taylor Swift grew her fan base back in 2010; the 246% gain was both fast and well deserved. The sweetener is that the annual five year growth rate of 63% is also impressive. So I'd be surprised if the P/E ratio was not above average.
Does Twin Disc Have A Relatively High Or Low P/E For Its Industry?
One good way to get a quick read on what market participants expect of a company is to look at its P/E ratio. The image below shows that Twin Disc has a lower P/E than the average (20.7) P/E for companies in the machinery industry.
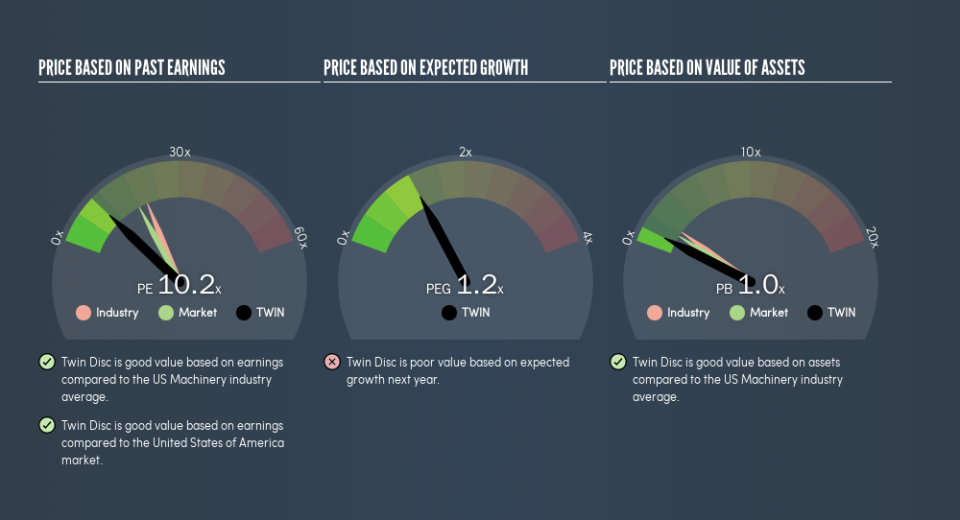
This suggests that market participants think Twin Disc will underperform other companies in its industry. Since the market seems unimpressed with Twin Disc, it's quite possible it could surprise on the upside. If you consider the stock interesting, further research is recommended. For example, I often monitor director buying and selling.
Don't Forget: The P/E Does Not Account For Debt or Bank Deposits
Don't forget that the P/E ratio considers market capitalization. In other words, it does not consider any debt or cash that the company may have on the balance sheet. In theory, a company can lower its future P/E ratio by using cash or debt to invest in growth.
Spending on growth might be good or bad a few years later, but the point is that the P/E ratio does not account for the option (or lack thereof).
Twin Disc's Balance Sheet
Net debt totals 18% of Twin Disc's market cap. That's enough debt to impact the P/E ratio a little; so keep it in mind if you're comparing it to companies without debt.
The Verdict On Twin Disc's P/E Ratio
Twin Disc has a P/E of 10.2. That's below the average in the US market, which is 17.9. The EPS growth last year was strong, and debt levels are quite reasonable. If it continues to grow, then the current low P/E may prove to be unjustified.
When the market is wrong about a stock, it gives savvy investors an opportunity. If it is underestimating a company, investors can make money by buying and holding the shares until the market corrects itself. So this free report on the analyst consensus forecasts could help you make a master move on this stock.
But note: Twin Disc may not be the best stock to buy. So take a peek at this free list of interesting companies with strong recent earnings growth (and a P/E ratio below 20).
We aim to bring you long-term focused research analysis driven by fundamental data. Note that our analysis may not factor in the latest price-sensitive company announcements or qualitative material.
If you spot an error that warrants correction, please contact the editor at editorial-team@simplywallst.com. This article by Simply Wall St is general in nature. It does not constitute a recommendation to buy or sell any stock, and does not take account of your objectives, or your financial situation. Simply Wall St has no position in the stocks mentioned. Thank you for reading.

