What Type Of Shareholder Owns Dr. Lal PathLabs Limited’s (NSE:LALPATHLAB)?

The big shareholder groups in Dr. Lal PathLabs Limited (NSE:LALPATHLAB) have power over the company. Large companies usually have institutions as shareholders, and we usually see insiders owning shares in smaller companies. I generally like to see some degree of insider ownership, even if only a little. As Nassim Nicholas Taleb said, ‘Don’t tell me what you think, tell me what you have in your portfolio.’
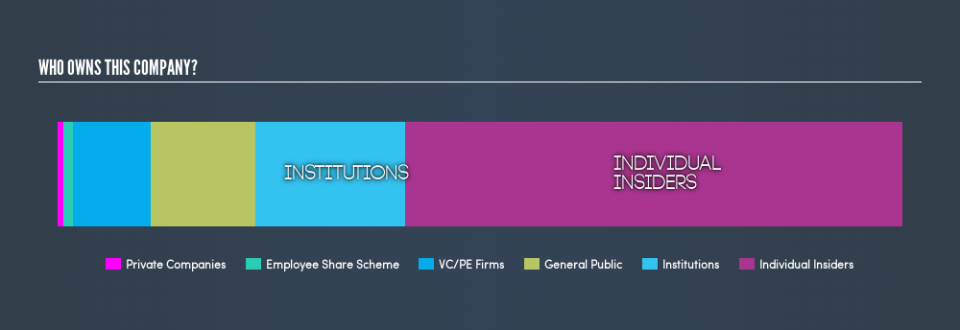
Dr. Lal PathLabs isn’t enormous, but it’s not particularly small either. It has a market capitalization of ₹89b, which means it would generally expect to see some institutions on the share registry. In the chart below below, we can see that institutional investors have bought into the company. Let’s take a closer look to see what the different types of shareholder can tell us about LALPATHLAB.
See our latest analysis for Dr. Lal PathLabs
Want to participate in a research study? Help shape the future of investing tools and earn a $60 gift card!
What Does The Institutional Ownership Tell Us About Dr. Lal PathLabs?
Institutions typically measure themselves against a benchmark when reporting to their own investors, so they often become more enthusiastic about a stock once it’s included in a major index. We would expect most companies to have some institutions on the register, especially if they are growing.
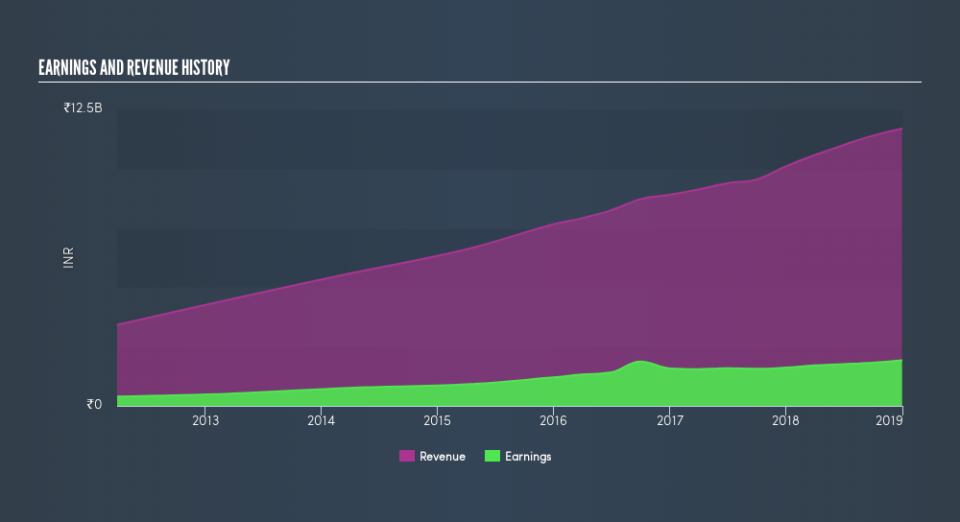
We can see that Dr. Lal PathLabs does have institutional investors; and they hold 18% of the stock. This implies the analysts working for those institutions have looked at the stock and they like it. But just like anyone else, they could be wrong. When multiple institutions own a stock, there’s always a risk that they are in a ‘crowded trade’. When such a trade goes wrong, multiple parties may compete to sell stock fast. This risk is higher in a company without a history of growth. You can see Dr. Lal PathLabs’s historic earnings and revenue, below, but keep in mind there’s always more to the story.
We note that hedge funds don’t have a meaningful investment in Dr. Lal PathLabs. There are plenty of analysts covering the stock, so it might be worth seeing what they are forecasting, too.
Insider Ownership Of Dr. Lal PathLabs
The definition of an insider can differ slightly between different countries, but members of the board of directors always count. Company management run the business, but the CEO will answer to the board, even if he or she is a member of it.
Most consider insider ownership a positive because it can indicate the board is well aligned with other shareholders. However, on some occasions too much power is concentrated within this group.
Our information suggests that insiders own more than half of Dr. Lal PathLabs Limited. This gives them effective control of the company. Insiders own ₹53b worth of shares in the ₹89b company. That’s extraordinary! It is good to see this level of investment. You can check here to see if those insiders have been selling any of their shares.
General Public Ownership
The general public, with a 12% stake in the company, will not easily be ignored. This size of ownership, while considerable, may not be enough to change company policy if the decision is not in sync with other large shareholders.
Private Equity Ownership
With an ownership of 9.2%, private equity firms are in a position to play a role in shaping corporate strategy with a focus on value creation. Some might like this, because private equity are sometimes activists who hold management accountable. But other times, private equity is selling out, having taking the company public.
Next Steps:
It’s always worth thinking about the different groups who own shares in a company. But to understand Dr. Lal PathLabs better, we need to consider many other factors.
Many find it useful to take an in depth look at how a company has performed in the past. You can access this detailed graph of past earnings, revenue and cash flow .
If you would prefer discover what analysts are predicting in terms of future growth, do not miss this free report on analyst forecasts.
NB: Figures in this article are calculated using data from the last twelve months, which refer to the 12-month period ending on the last date of the month the financial statement is dated. This may not be consistent with full year annual report figures.
We aim to bring you long-term focused research analysis driven by fundamental data. Note that our analysis may not factor in the latest price-sensitive company announcements or qualitative material.
If you spot an error that warrants correction, please contact the editor at editorial-team@simplywallst.com. This article by Simply Wall St is general in nature. It does not constitute a recommendation to buy or sell any stock, and does not take account of your objectives, or your financial situation. Simply Wall St has no position in the stocks mentioned. Thank you for reading.

