U.S-China Trade Buzz Sparks Appetite for Steel Options
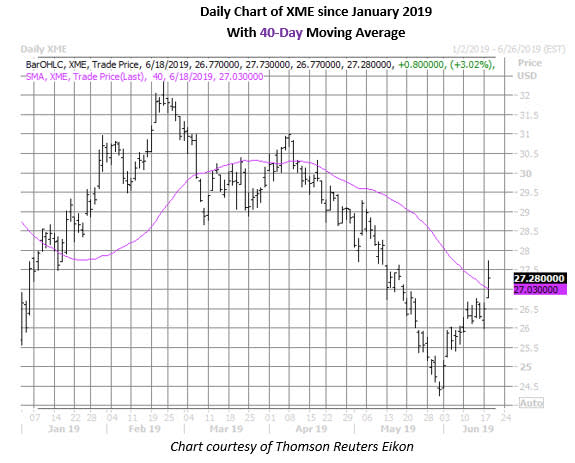
Upbeat U.S.-China trade headlines are creating a boon for the steel sector today, with the SPDR S&P Metals & Mining ETF (XME) up 3% at $27.28. The positive price action has sparked a rush of activity in XME's options pits, with calls crossing at 33 times what's typically seen at this point.
By the numbers, 63,711 XME calls have traded so far, a new annual high and 13 times the number of puts on the tape. The January 2020 series is most active, with speculators possibly selling to open the 28- and 31-strike calls.
Shorter-term traders, meanwhile, may be purchasing new positions at the June 25 put. If this is the case, they are betting on a quick retreat for the metals exchange-traded fund (ETF) by the close this Friday, June 21.
The $25 mark has been notable on XME's chart, and has served as a floor for the fund going back to July 2016. Since dipping below here in late May when they hit a nearly two-year low of $24.25, the shares have gained 12.5%, and are currently on track to close above their 40-day moving average for the first time since April 8.
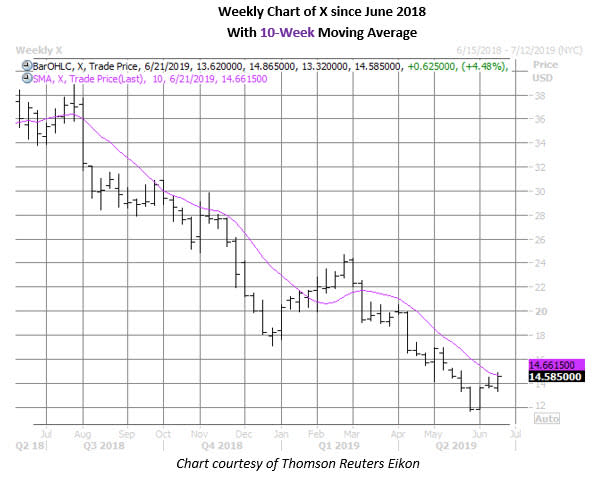
The upside is being seen in individual steel stocks, too, with United States Steel Corporation (NYSE:X) trading 4.7% higher at $14.62. The stock's options pits are bustling, and call traders are dominating the action. Most recently, 48,000 calls and 28,000 puts are on the tape, double the expected intraday amount.
Diving deeper, the June 14.50 and 15 calls are popular, with Trade-Alert suggesting the a potential roll-up of a short call position. In this scenario, the speculator expects X stock to remain below $15 through front-month options expiration at the close this Friday, June 21. Elsewhere, the weekly 6/28 14-strike put and 15-strike call are possibly being used in a risk-reversal strategy.
More broadly speaking, put buying has been accelerated in recent weeks, relative to call buying. At the International Securities Exchange (ISE), Chicago Board Options Exchange (CBOE), and NASDAQ OMX PHLX (PHLX), U.S. Steel's 10-day put/call volume ratio of 0.77 ranks in the elevated 72nd annual percentile.
This skepticism is seen elsewhere, and it's not too surprising given X stock's longer-term technical troubles. Year-over-year, the shares are down 40%. And while the equity is up 25% from its May 31 two-year low of $11.67, this rally is running out of steam near U.S. Steel's 10-week moving average, which hasn't been surpassed on a weekly closing basis since early March.