U.S. Dollar Index Futures (DX) Technical Analysis – Closing Price Reversal Top Confirmed
The U.S. Dollar retreated from a two-year high against a basket of currencies on Thursday, forming a potentially bearish closing price reversal top in the process. Most of the move was fueled by a wicked closing price reversal bottom in the Euro.
The sell-off in the U.S. Dollar was caused by a report that showed U.S. manufacturer growth hit a multiyear low in May, the latest sign that the trade war may be slowing the economy. The news drove down U.S. Treasury yields, which made the U.S. Dollar a less-attractive investment.
With U.S.-China trade relations deteriorating, conditions could worsen for the U.S. economy. This could lead to further pressure on the U.S. Dollar as Forex investors would be forced to make adjustments to account for a possible interest rate cut by the U.S. Federal Reserve.
At 06:50 GMT, June U.S. Dollar Index futures are trading 97.620, down 0.103 or -0.11%.
Daily Swing Chart Technical Analysis
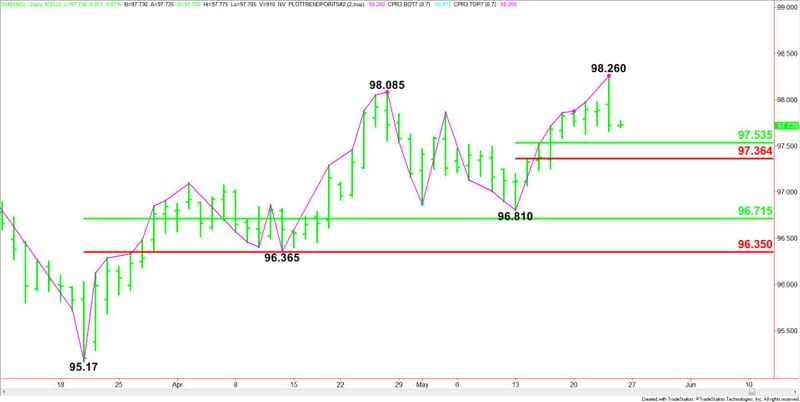
The main trend is up according to the daily swing chart. However, momentum shifted to the downside with the formation of the closing price reversal top on Thursday and the subsequent confirmation earlier today.
The chart pattern does not mean the trend is changing to down, but it could lead to a 2 to 3 day correction.
A trade through 98.260 will negate the closing price reversal top and signal a resumption of the uptrend. A move through 96.810 will change the main trend to down.
The short-term range is 96.810 to 98.260. The first downside target is its retracement zone at 97.535 to 97.365. Since the main trend is up, look for buyers to show up on the first test of this zone. Look for an even steeper break if 97.365 fails as support.
The main range is 95.170 to 98.260. If the main trend changes to down then look for the selling to continue into its retracement zone at 96.715 to 96.350.
Daily Swing Chart Technical Forecast
With the confirmation of the closing price reversal top, we’re looking for the selling to continue into the short-term 50% level at 97.535. We could see a technical bounce on the first test of this level.
If 97.535 fails then look for the selling to possibly extend into the short-term Fibonacci level at 97.364. Buyers could also show up on a test of this level.
If 97.364 fails then look for the selling pressure to increase. This could lead to an acceleration to the downside with the main bottom at 96.810 and the main Fibonacci level at 96.715, the next downside targets.
Overview
Watch the Euro for direction since it represents about 57% of the index. A weaker Euro could trigger a turnaround in the index. A stronger Euro will likely mean further downside pressure on the dollar index.
Today’s U.S. Durable goods report and the European Parliamentary Elections could be the catalysts behind heightened volatility. Dollar bulls don’t want to see a weak durable goods report.
This article was originally posted on FX Empire

