Understanding Smart Beta ETFs' Indexes
https://www.etf.com/sites/all/themes/etf_com/images/logo.png
Smart beta ETFs make up a small, but growing, slice of the top three index providers’ business, based on ETF assets.
At First Bridge Data, a CFRA company, index-based ETFs are split between traditional beta funds that track a market-cap-weighted index; smart beta funds that track an alternatively weighted index; and leveraged/inverse ETFs that either amplify or seek to benefit from the decline in the returns of market-cap-weighted indexes.
Smart beta funds have gained in popularity in recent years, as investors have sought to improve on the reward or reduce the risk of traditional beta funds without employing leverage. Some smart beta types include dividend, low volatility, value and multifactor; the latter combines multiple metrics in one index-based approach.
Yet smart beta remains a modest percentage of ETF assets tied to indexes from the top three index providers as demand for lower-cost traditional beta funds has been even stronger.
S&P Dow Jones Indices Smart Beta Share (8% of index-based assets)
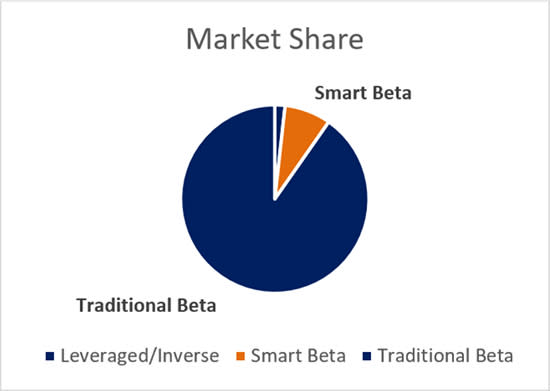
Source: First Bridge Data, a CFRA company; March 31, 2020
S&P Dow Jones Indices had the most ETF assets tied to its indexes, $1.2 trillion as of the end of the first quarter, aided by the dominance of the SPDR S&P 500 ETF Trust (SPY), the iShares Core S&P 500 ETF (IVV) and the Vanguard S&P 500 ETF (VOO)—but only 8% of index-tracking assets were from smart beta. In contrast, 20% of MSCI’s $483 billion and 12% of FTSE Russell’s $464 billion were in smart beta based funds.
MSCI and FTSE Russell have a strong international equity index presence driven by the iShares Core MSCI Emerging Markets ETF (IEMG), the iShares MSCI EAFE ETF (EFA), the Vanguard FTSE Developed Markets ETF (VEA) and the Vanguard FTSE Emerging Markets ETF (VWO).
Yet these funds are smaller than their S&P 500 Index-based counterparts, which helps drive higher the percentage of smart-beta-based index assets for MSCI and FTSE Russell. All three firms have significantly limited exposure to leverage/inverse ETFs.
MSCI Smart Beta Share (20% of index-based assets)

Source: First Bridge Data, a CFRA company; March 31, 2020
FTSE Russell Smart Beta Share (12% of index-based assets)

Source: First Bridge Data, a CFRA company. March 31, 2020
Know Your Index Provider
While some index-based smart beta ETFs like the iShares Edge MSCI U.S.A. Momentum Factor ETF (MTUM) make it clear what index is being tracked, this is not the case with all funds.
For example, the Schwab U.S. Dividend Equity ETF (SCHD) replicates a Dow Jones dividend growth index that is part of the S&P Dow Jones family. The Vanguard High Dividend Yield ETF (VYM) is another instance where the FTSE Russell index takes a back seat in the fund name. Neither Schwab nor Vanguard makes the decisions on what companies to include inside the ETF.
While MSCI has licensed its smart beta indexes for ETFs managed by DWS, Nuveen and State Street Global Advisors, the firm’s relationship with iShares is unmatched. The 10 largest smart beta ETFs tracking MSCI benchmarks are all offered by iShares, and totaled $82 billion as of March.
Four of these ETFs are classified as low volatility funds, which seek to own the less risky stocks with a broader benchmark in hopes of limiting the impact of market gyrations. The iShares Edge MSCI Min Vol U.S.A. ETF (USMV) was the largest, with $31 billion in assets at quarter end, but the iShares Edge MSCI Min Vol EAFE ETF (EFAV), the iShares Edge MSCI Min Vol Global ETF (ACWV) and the iShares Edge MSCI Emerging Markets ETF (EEMV) were also among the top 10, providing unique regional or global exposure with the same risk-reducing approach.
Largest Smart-Beta ETFs Tied To MSCI Index (Assets In $M)
Name | Ticker | Family | Smart Beta Type | Assets ($M) |
iShares | Low Volatility | 30,734 | ||
iShares | Quality | 15,237 | ||
iShares | Low Volatility | 10,425 | ||
iShares | Momentum | 8,095 | ||
iShares | Low Volatility | 5,003 | ||
iShares s | Low Volatility | 3,969 | ||
iShares | Thematic | 3,509 | ||
iShares | Thematic | 1,894 | ||
iShares | Thematic | 1,583 | ||
iShares | Thematic | 1,556 |
Source: First BrSource: First Bridge Data, a CFRA company; March 31, 2020
An additional four top 10 funds provided regional or global exposure to stocks that met MSCI’s environmental, social and governance criteria, led by the $3.5 billion iShares ESG MSCI U.S.A. ETF (ESGU) and the $1.9 billion iShares ESG MSCI EM ETF (ESGE).
S&P Dow Jones Indices has a broader array of large partners than MSCI. Five different asset managers were represented in the top 10 ETFs that tracked an S&P Dow Jones Index, and all offered a dividend strategy.
The SPDR S&P Dividend ETF (SDY) was the largest, with $14 billion in assets, focused on historical dividend growth. That was followed by the iShares Select Dividend ETF (DVY), which has a greater dependence on the dividend yield.
The Schwab U.S. Dividend ETF (SCHD) and the ProShares S&P 500 Dividend Aristocrats ETF (NOBL) are two additional large funds focused solely on equity income, while the Invesco S&P 500 High Dividend Low Volatility ETF (SPHD) combines dividends and low volatility metrics—providing the potential for even more risk mitigation.
Largest Smart-Beta ETFs Tied To S&P Dow Jones Index (Assets In $M)
Name | Ticker | Family | Smart Beta Type | Assets ($M) |
State Street | Dividend | 14,192 | ||
iShares | Dividend | 12,521 | ||
Invesco | Equal Weighted | 10,441 | ||
Schwab | Dividend | 9,654 | ||
Invesco | Low Volatility | 9,044 | ||
ProShares | Dividend | 5,074 | ||
iShares | Dividend | 3,299 | ||
iShares | Thematic | 2,742 | ||
Invesco | Low Volatility | 2,505 | ||
Invesco | Multi Factor | 2,440 |
Source: First Bridge Data, a CFRA company; March 31, 2020
As at MSCI, there has been demand for S&P Dow Jones-based low volatility ETFs. The Invesco S&P 500 Low Volatility ETF (SPLV) is a large cap peer of USMV, while the Invesco S&P MidCap Low Volatility ETF (XMLV) offers exposure to more midsize companies like MDU Resources.
Similar Names Can Have Different Holdings
While the minimum volatility ETFs USMV and SPLV both generate less volatility than the S&P 500 Index, they are constructed differently. USMV has sector constraints and typically has higher exposure to cyclical sectors like information technology (18% of recent assets) than defensive sectors like utilities (9%).
Meanwhile, it is common for SPLV to have the inverse, with exposure to utilities (29%) recently much higher than information technology (6%). Year to date through April 17, USMV’s 7.8% decline was narrower than SPLV’s 11%, highlighting that these are not clones.
When it comes to multifactor indexes, FTSE Russell offers an array of indexes tracked by ETFs that combine more than one smart beta metric. For example, the $4.9 billion Schwab Fundamental U.S. Large Company Index ETF (FNDX), the second largest smart beta ETF connected to the firm, is constructed based on fundamental metrics; namely, sales, cash flow, dividends and buybacks.
Three of the four metrics are also used in the Invesco FTSE RAFI U.S. 1000 ETF (PRF), a $3.8 billion ETF, but book value replaces buybacks. Despite largely similar approaches, the portfolios are different. FNDX’s largest sector weighting as of mid-April was information technology, at 20% of assets, but this sector was just a 15% stake in PRF.
As with S&P Dow Jones Indices, a dividend ETF tracking a FTSE Russell Index had the most assets. The Vanguard High Dividend Yield ETF (VYM) recently had $24 billion in assets, more than the next nine largest ETFs that track a FTSE Russell Index combined. VYM is a peer of DVY, focused on high-dividend-yielding securities. Vanguard also offers an international version, the Vanguard International High Dividend Yield ETF (VYMI), which has $1.1 billion in assets.
Largest Smart-Beta ETFs Tied To FTSE Russell Index (Assets In $M)
Name | Ticker | Family | Smart Beta Type | Assets ($M) |
Vanguard | Dividend | 23,553 | ||
Schwab | Multi Factor | 4,875 | ||
Schwab | Multi Factor | 3,879 | ||
Invesco | Multi Factor | 3,796 | ||
Schwab | Multi Factor | 2,924 | ||
Schwab | Multi Factor | 2,065 | ||
Schwab | Multi Factor | 1,570 | ||
Franklin | Multi Factor | 1,312 | ||
Invesco | Multi Factor | 1,257 | ||
Vanguard | Dividend | 1,118 |
Source: First Bridge Data, a CFRA company; March 31, 2020
Conclusion
Smart beta ETFs come in different shapes and sizes, as MSCI, S&P Dow Jones and FTSE Russell have partnered with asset managers to help with potential reward generation or risk mitigation.
While each index provider has had high success with one or two approaches, investors need to understand that the different ingredients used in their kitchens result in distinct portfolios.
A close look inside explains why the performance records do not match, and highlights the merits of a holdings-based ETF star ratings approach like the one used by CFRA.
All of the views expressed in this research report accurately reflect the research analyst's personal views regarding any and all of the subject securities or issuers. No part of the analyst's compensation was, is, or will be, directly or indirectly, related to the specific recommendations or views expressed in this research report. For more information, please refer to CFRA's Legal Notice at https://www.cfraresearch.com/legal/
Copyright © 2020 CFRA. All rights reserved. All trademarks mentioned herein belong to their respective owners.
Recommended Stories

