Is United Overseas Australia (ASX:UOS) Using Too Much Debt?

Some say volatility, rather than debt, is the best way to think about risk as an investor, but Warren Buffett famously said that 'Volatility is far from synonymous with risk. When we think about how risky a company is, we always like to look at its use of debt, since debt overload can lead to ruin. As with many other companies United Overseas Australia Limited (ASX:UOS) makes use of debt. But should shareholders be worried about its use of debt?
What Risk Does Debt Bring?
Debt assists a business until the business has trouble paying it off, either with new capital or with free cash flow. Part and parcel of capitalism is the process of 'creative destruction' where failed businesses are mercilessly liquidated by their bankers. However, a more frequent (but still costly) occurrence is where a company must issue shares at bargain-basement prices, permanently diluting shareholders, just to shore up its balance sheet. Having said that, the most common situation is where a company manages its debt reasonably well - and to its own advantage. The first step when considering a company's debt levels is to consider its cash and debt together.
See our latest analysis for United Overseas Australia
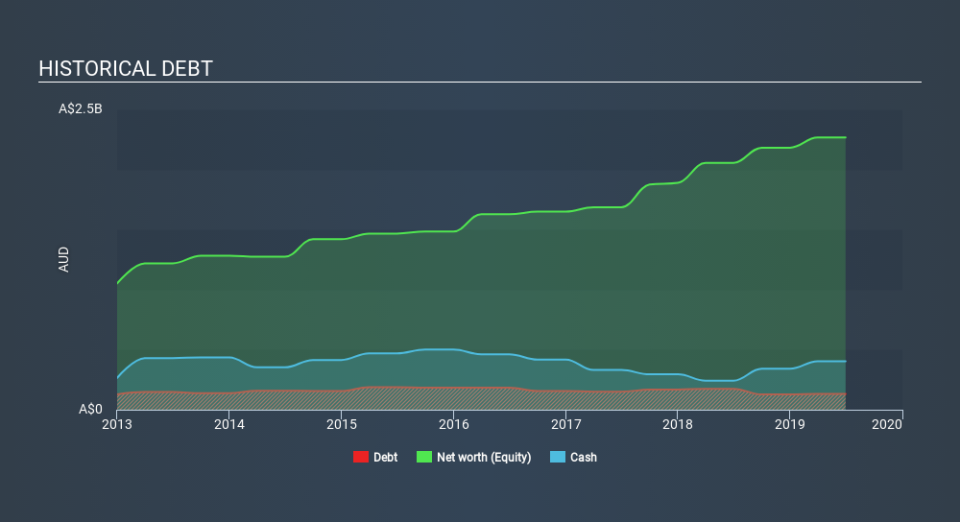
What Is United Overseas Australia's Net Debt?
As you can see below, United Overseas Australia had AU$130.9m of debt at June 2019, down from AU$174.7m a year prior. However, it does have AU$403.6m in cash offsetting this, leading to net cash of AU$272.7m.
How Strong Is United Overseas Australia's Balance Sheet?
The latest balance sheet data shows that United Overseas Australia had liabilities of AU$319.9m due within a year, and liabilities of AU$44.1m falling due after that. On the other hand, it had cash of AU$403.6m and AU$288.0m worth of receivables due within a year. So it can boast AU$327.5m more liquid assets than total liabilities.
This surplus suggests that United Overseas Australia is using debt in a way that is appears to be both safe and conservative. Due to its strong net asset position, it is not likely to face issues with its lenders. Succinctly put, United Overseas Australia boasts net cash, so it's fair to say it does not have a heavy debt load!
Another good sign is that United Overseas Australia has been able to increase its EBIT by 21% in twelve months, making it easier to pay down debt. The balance sheet is clearly the area to focus on when you are analysing debt. But it is United Overseas Australia's earnings that will influence how the balance sheet holds up in the future. So when considering debt, it's definitely worth looking at the earnings trend. Click here for an interactive snapshot.
Finally, while the tax-man may adore accounting profits, lenders only accept cold hard cash. While United Overseas Australia has net cash on its balance sheet, it's still worth taking a look at its ability to convert earnings before interest and tax (EBIT) to free cash flow, to help us understand how quickly it is building (or eroding) that cash balance. Looking at the most recent three years, United Overseas Australia recorded free cash flow of 49% of its EBIT, which is weaker than we'd expect. That's not great, when it comes to paying down debt.
Summing up
While it is always sensible to investigate a company's debt, in this case United Overseas Australia has AU$272.7m in net cash and a decent-looking balance sheet. And it impressed us with its EBIT growth of 21% over the last year. So we don't think United Overseas Australia's use of debt is risky. Another positive for shareholders is that it pays dividends. So if you like receiving those dividend payments, check United Overseas Australia's dividend history, without delay!
When all is said and done, sometimes its easier to focus on companies that don't even need debt. Readers can access a list of growth stocks with zero net debt 100% free, right now.
If you spot an error that warrants correction, please contact the editor at editorial-team@simplywallst.com. This article by Simply Wall St is general in nature. It does not constitute a recommendation to buy or sell any stock, and does not take account of your objectives, or your financial situation. Simply Wall St has no position in the stocks mentioned.
We aim to bring you long-term focused research analysis driven by fundamental data. Note that our analysis may not factor in the latest price-sensitive company announcements or qualitative material. Thank you for reading.

