Is Universal Health Services, Inc. (NYSE:UHS) A Financially Sound Company?

There are a number of reasons that attract investors towards large-cap companies such as Universal Health Services, Inc. (NYSE:UHS), with a market cap of US$12b. Doing business globally, large caps tend to have diversified revenue streams and attractive capital returns, making them desirable investments for risk-averse portfolios. But, the health of the financials determines whether the company continues to succeed. This article will examine Universal Health Services’s financial liquidity and debt levels to get an idea of whether the company can deal with cyclical downturns and maintain funds to accommodate strategic spending for future growth. Note that this commentary is very high-level and solely focused on financial health, so I suggest you dig deeper yourself into UHS here.
View our latest analysis for Universal Health Services
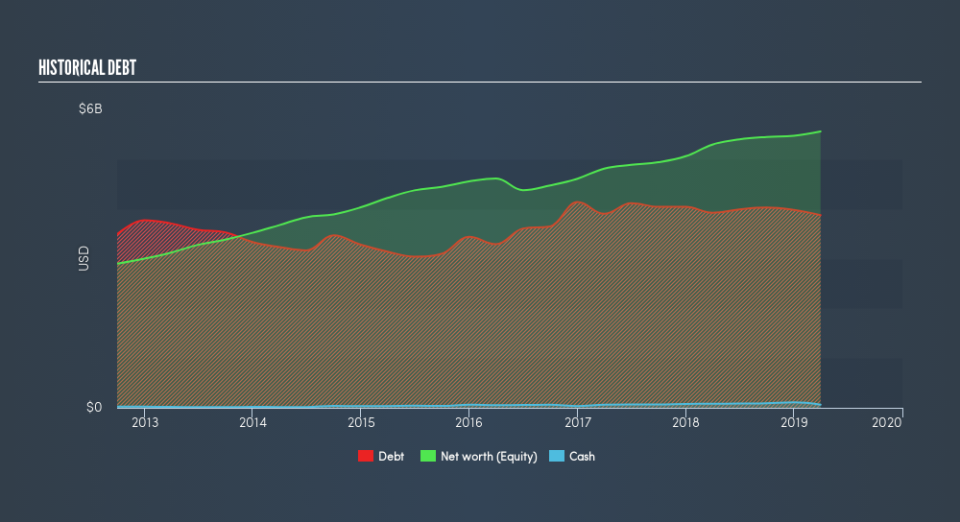
UHS’s Debt (And Cash Flows)
UHS's debt levels surged from US$3.9b to US$4.2b over the last 12 months , which accounts for long term debt. With this increase in debt, UHS's cash and short-term investments stands at US$64m , ready to be used for running the business. Moreover, UHS has generated cash from operations of US$1.3b during the same period of time, resulting in an operating cash to total debt ratio of 31%, meaning that UHS’s current level of operating cash is high enough to cover debt.
Does UHS’s liquid assets cover its short-term commitments?
At the current liabilities level of US$1.7b, the company has maintained a safe level of current assets to meet its obligations, with the current ratio last standing at 1.18x. The current ratio is calculated by dividing current assets by current liabilities. For Healthcare companies, this ratio is within a sensible range since there's a sufficient cash cushion without leaving too much capital idle or in low-earning investments.
Can UHS service its debt comfortably?
With a debt-to-equity ratio of 70%, UHS can be considered as an above-average leveraged company. This is common amongst large-cap companies because debt can often be a less expensive alternative to equity due to tax deductibility of interest payments. Since large-caps are seen as safer than their smaller constituents, they tend to enjoy lower cost of capital. We can test if UHS’s debt levels are sustainable by measuring interest payments against earnings of a company. Net interest should be covered by earnings before interest and tax (EBIT) by at least three times to be safe. For UHS, the ratio of 7.87x suggests that interest is well-covered. Large-cap investments like UHS are often believed to be a safe investment due to their ability to pump out ample earnings multiple times its interest payments.
Next Steps:
Although UHS’s debt level is towards the higher end of the spectrum, its cash flow coverage seems adequate to meet obligations which means its debt is being efficiently utilised. Since there is also no concerns around UHS's liquidity needs, this may be its optimal capital structure for the time being. This is only a rough assessment of financial health, and I'm sure UHS has company-specific issues impacting its capital structure decisions. I suggest you continue to research Universal Health Services to get a more holistic view of the large-cap by looking at:
Future Outlook: What are well-informed industry analysts predicting for UHS’s future growth? Take a look at our free research report of analyst consensus for UHS’s outlook.
Valuation: What is UHS worth today? Is the stock undervalued, even when its growth outlook is factored into its intrinsic value? The intrinsic value infographic in our free research report helps visualize whether UHS is currently mispriced by the market.
Other High-Performing Stocks: Are there other stocks that provide better prospects with proven track records? Explore our free list of these great stocks here.
We aim to bring you long-term focused research analysis driven by fundamental data. Note that our analysis may not factor in the latest price-sensitive company announcements or qualitative material.
If you spot an error that warrants correction, please contact the editor at editorial-team@simplywallst.com. This article by Simply Wall St is general in nature. It does not constitute a recommendation to buy or sell any stock, and does not take account of your objectives, or your financial situation. Simply Wall St has no position in the stocks mentioned. Thank you for reading.
