USD/JPY Forex Technical Analysis – Weekly Volatility Expected; Strengthens Over 111.960, Weakens Under 110.680
The Dollar/Yen finished higher last week with most of the gains coming early in the week. The buying was fueled by increased demand for risky assets. However, the Forex pair weakened late in the week after the U.S. reported weak manufacturing data. The news pressured U.S. Treasury yields which made the U.S. Dollar a less-desirable asset.
The Forex pair also traded inside the previous week’s range. This suggests investor indecision and impending volatility. And why not? We could see big movement in the Dollar/Yen starting on Wednesday following the U.S. Federal Reserve’s interest rate decision and monetary policy decision. Additionally, the Fed will offer up new economic projections that could create volatile trading conditions.
For the week, the USD/JPY settled at 111.469, up 0.299 or +0.27%.
Weekly Technical Analysis
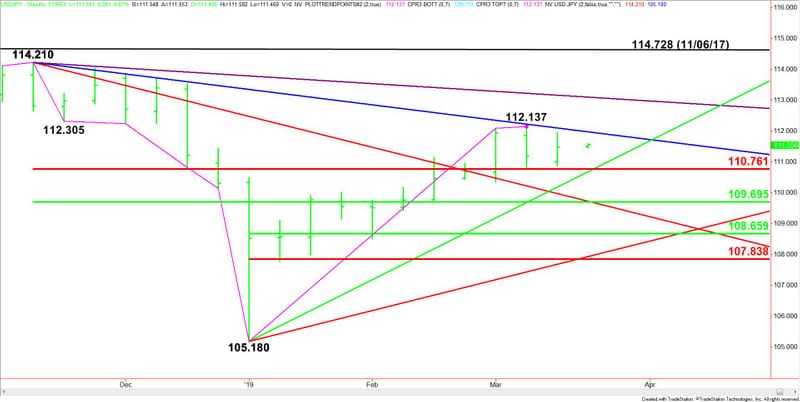
The main trend is down according to the weekly swing chart. However, momentum is trending higher. Additionally, a closing price reversal top from the week-ending March 8 is indicating the presence of sellers.
A trade through 112.137 will negate the closing price reversal top and signal a resumption of the upside momentum. A move through 110.787 will confirm the closing price reversal top. This will increase downside momentum and signal the start of a 2 to 3 week correction.
The minor trend is up. This is helping to generate some upside momentum. The minor trend will change to down on a trade through 108.495. This will be further confirmation of a shift in momentum to the downside.
The main range is 114.210 to 105.180. Its retracement zone at 110.761 to 109.695 is the nearest support. This zone is controlling the near-term direction of the USD/JPY.
The short-term range is 105.180 to 112.137. If the closing price reversal top is confirmed then look for the selling to possibly extend into its retracement zone at 108.659 to 107.838.
Weekly Technical Forecast
Based on the price action the last two weeks, the direction of the USD/JPY this week is likely to be determined by trader reaction to a downtrending Gann angle at 111.960 and an uptrending Gann angle at 110.680.
Bullish Scenario
Holding above 110.761 to 110.680 will indicate that buyers are coming in to support the USD/JPY. If momentum increases on the move then look for buyers to make a run at the downtrending Gann angle at 111.960 and the closing price reversal top at 112.137.
Taking out 112.137 will indicate the buying is getting stronger. This could trigger a breakout to the upside with the next downtrending Gann angle coming in at 113.09. This is the last major resistance angle before the 114.210 main top.
Bearish Scenario
The inability to overcome the downtrending Gann angle at 111.960 will signal the presence of sellers. If this move creates enough downside momentum then look for the selling to possibly extend into the support cluster at 110.761 to 110.680.
The Gann angle at 110.680 is a potential trigger point for an acceleration to the downside with the next target another support cluster at 109.710 to 109.695.
This article was originally posted on FX Empire

