USD/JPY Forex Technical Analysis – Major Support Cluster at 106.706 to 106.450
The Dollar/Yen posted its fourth-consecutive loss on Friday after surging to a one-month high earlier in the week. Several factors contributed to the weakness with one being the implementation of trillions of dollar’s worth of stimulus efforts by governments and central banks in an effort to combat the economic impact of the coronavirus.
On Friday, the USD/JPY settled at 107.977, down 1.616 or -1.47%.
Another factor that weakened the U.S. Dollar was the signing of a $2.2 trillion stimulus bill. The news helped boost risk appetite, while reducing demand for the safe-haven greenback. Additionally, the Dollar/Yen also weakened after an unprecedented rise in jobless claims led investors to anticipate that the U.S. government and Federal Reserve would take new steps to stimulate the economy.
Daily Technical Analysis
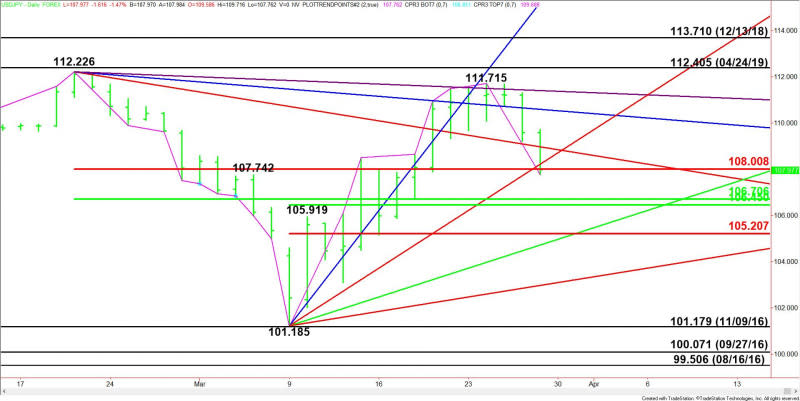
The main trend is down according to the daily swing chart. However, momentum has been trending higher since the March 9 main bottom at 101.185.
A trade through 111.715 will change the main trend to up. A move through the last main bottom at 101.185 will signal a resumption of the downtrend.
The first main range is 112.226 to 101.185. Its retracement zone at 108.008 to 107.706 is the first potential support area.
The second main range is 101.185 to 111.715. Its retracement zone at 106.450 to 105.207 is the next potential support area.
Combining the two zones forms a potential support cluster at 106.706 to 106.450. Trader reaction to this zone could determine the near-term direction of the USD/JPY.
Short-Term Outlook
The USD/JPY settled at 107.977 on Friday. This puts it slightly under the Fibonacci level at 108.008. If the Forex pair continues to move lower then look for a test of the support cluster at 106.706 to 106.450. This is the area that traders should be watching.
Aggressive counter-trend buyers could come in on a test of this area in an effort to form a potentially bullish secondary higher bottom. They may take a run at the last main top at 111.715 in an effort to change the main trend to up.
If 106.450 fails as support then look for the selling to possibly extend into the lower Fibonacci level at 105.207.
This article was originally posted on FX Empire
More From FXEMPIRE:
The Weekly Wrap – A Dollar Slump, The Stimulus Bill, and The Coronavirus Grabbed the Headlines
EUR/USD Forex Technical Analysis – Near-Term Strength Over 1.1167, Sellers Return Under 1.1066
AUD/USD Forex Technical Analysis – Strong Upside Momentum Could Trigger Breakout Over .6236
Natural Gas Price Prediction – Prices Fall and Downtrend Remain in Tact
Gold Price Futures (GC) Technical Analysis – Needs to Hold $1610.50 – $1580.40 to Sustain the Rally

