USD/JPY Forex Technical Analysis – Needs Sustained Move Over 108.963 to Shift Momentum to Upside
The Dollar/Yen is edging lower early Thursday amid mixed signals this week over a U.S.-China trade deal. Weaker-than-expected U.S. economic data is also weighing on the Forex pair. On Wednesday, the Dollar/Yen posted a dramatic reversal to the upside, but so far we haven’t seen any follow-through move, which suggests it may have been fueled by aggressive short-covering.
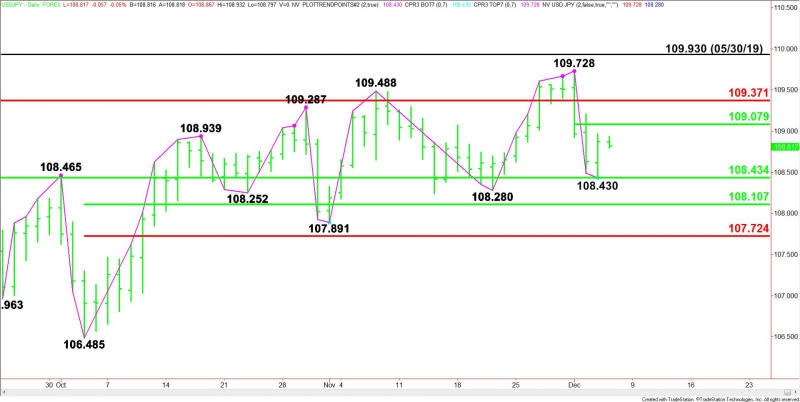
At 04:58 GMT, the USD/JPY is trading 108.850, down 0.024 or -0.03%.
The price action so far this week has been driven by “risk-off” then “risk-on” sentiment. Driving the risk-off portion has been weaker than expected reports on ISM US Manufacturing PMI, ISM US Non-Manufacturing PMI and ADP Private Jobs. Worries that a trade deal would be postponed until after the 2020 US Presidential election in November also pressured the Dollar/Yen, but this was offset by Wednesday’s report from Bloomberg that the US and China may be inching close to a trade deal. As of yesterday’s close, it was risk-on again.
Daily Swing Chart Technical Analysis
The main trend is up according to the daily swing chart, however, momentum has been trending lower since Monday’s closing price reversal top. A trade through 108.280 will change the main trend to down. A move through 109.728 will signal a resumption of the uptrend.
The nearest support is a 50% level at 108.434. This level stopped the selling on Wednesday at 108.430.
The next retracement zone support comes in at 108.107 to 107.724.
The short-term range is 109.728 to 108.430. Its 50% level at 109.079 is the first upside target. This is followed by a Fibonacci level at 109.371.
Daily Swing Chart Technical Forecast
Based on Wednesday’s minor reversal bottom at 108.430, the direction of the USD/JPY on Thursday will be determined by trader reaction to yesterday’s high at 108.963.
Bullish Scenario
A trade through 108.963 will indicate the presence of buyers. It will also confirm the closing price reversal bottom. This could trigger a further rally into the short-term 50% level at 109.079. This is a potential trigger point for an acceleration to the upside with 109.371 the next likely upside target.
Bearish Scenario
A sustained move under 108.963 will signal the presence of sellers. This could lead to a retest of the support cluster at 108.434 to 108.430. If this area fails then look for the selling to possibly extend into the main bottom at 108.280 and the 50% level at 108.107.
This article was originally posted on FX Empire
