New USDA map for gardeners, growers shows Iowa getting warmer. How much?
The U.S. Department of Agriculture's latest Plant Hardiness Zone Map shows Iowa is warming up, at least a little bit.
Updated in November for the first time since 2012, the map, a standard guide to plants' tolerance of extreme cold, has shifted parts of Iowa to warmer zones compatible for less-hardy plants.
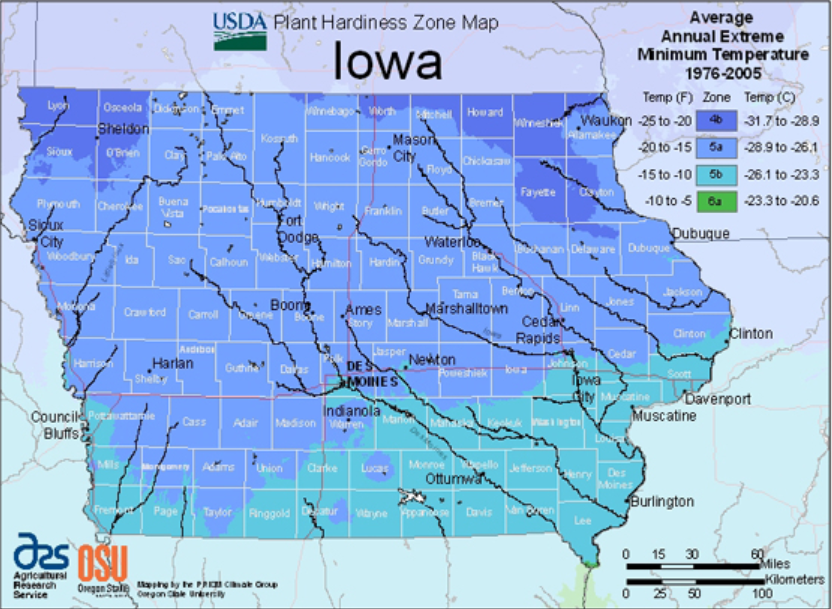
It separates the U.S. into 13 zones based on average annual low temperatures. The zones are divided into 10-degree increments and further divided into half zones by 5-degree increments
"The new Plant Hardiness Zone Map is generally about one quarter-zone warmer throughout much of the United States," Aaron Steil, consumer horticulture Iowa State University extension specialist, said in an analysis of the new map.
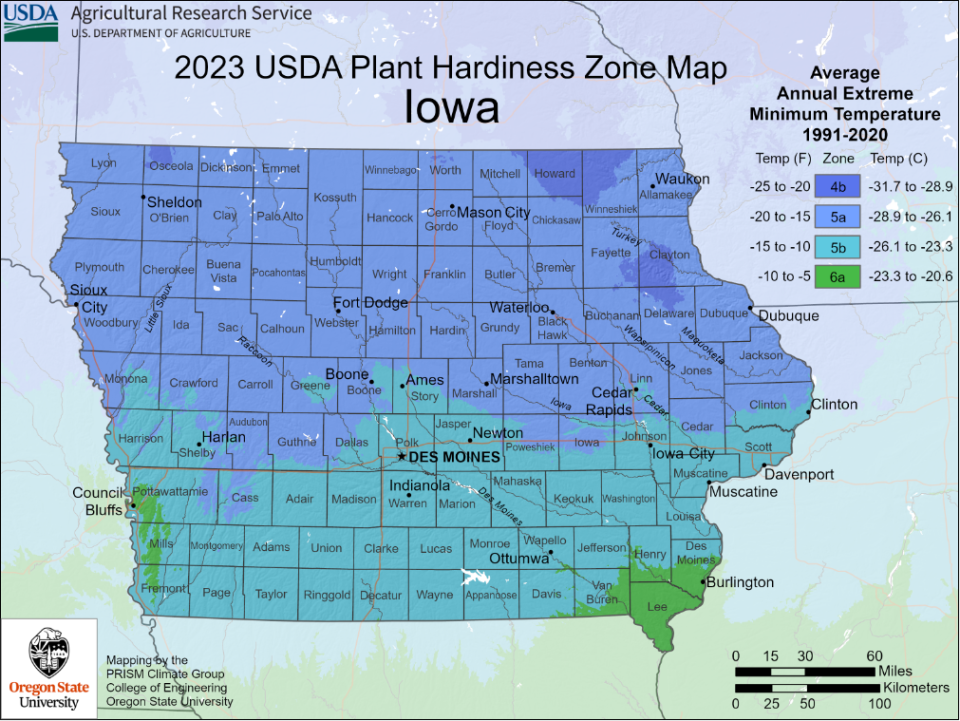
Ames and much of Des Moines had been in Zone 5a, considered safe for plants that can tolerate temperatures down to minus-20 degrees. The new map puts them in Zone 5b, where the limit of tolerance is a slightly more hospitable minus-15 degrees
The rest of Iowa now ranges from Zone 4b, with a temperature threshold of minus-25 degrees, to Zone 6a in the extreme southeast and southwest, with a minus-10 degree threshold. The addition of 6a zones is a first for Iowa.
What is the USDA plant hardiness zone map?
Implemented in 1960, the Plant Hardiness Zone map has become an important tool for gardeners nationwide when selecting trees, shrubs and perennials that can survive the winter.
The USDA Agricultural Research Service and Oregon State University's PRISM Climate Group developed the updated map.
"The new map ... is more accurate and contains greater detail than prior versions," says a USDA news release.
It says the data for the 2023 map was collected using averages of the lowest annual winter temperatures at specific locations from 1991 to 2020.
The 2012 version of the map was based upon data from 1976 to 2005.
What is the map used for?
The map has a variety of uses, the USDA said. It's mainly for gardeners and commercial growers, but the USDA Risk Management Agency uses it to set certain crop insurance standards and it also figures in many research models, such as those tracking the spread of exotic weeds and insects, according to the release.

What does this change mean for Iowa?
What will a warmer Iowa mean for Iowa's landscapes and farms? Can residents of Iowa's new 6a zones now confidently plant less-tolerant varieties of peonies along with the hardier hydrangeas suited to Zone 5b?
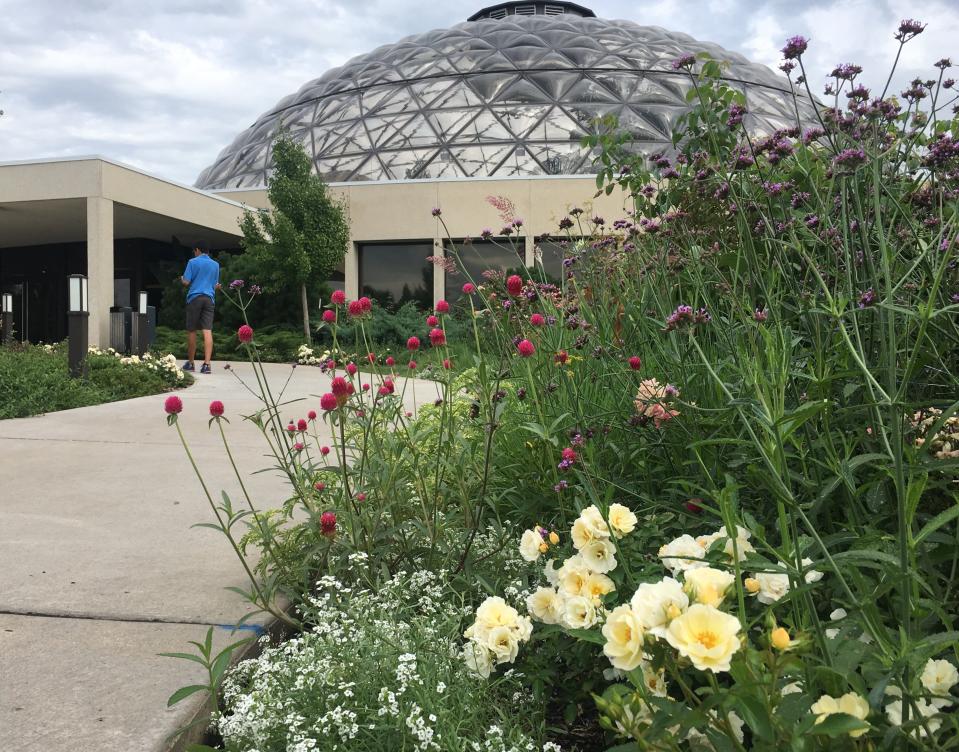
The professional gardeners at the Greater Des Moines Botanical Garden are taking a cautious approach.
Aaron Harpold, the gardens' director of horticulture, said he and his staff have "just begun to notice things ... flowering earlier," but also have been dealing with greater weather extremes.
"I can tell you, just being in the garden every day, that you do start noticing the differences," he said.
The developers of the map caution against concluding that the updated map is an indication of global warming.
"Some changes in zonal boundaries are also the result of using increasingly sophisticated mapping methods and the inclusion of data from more weather stations," the USDA release said.
How to use the plant hardiness zone map
Steil in his analysis reminded Iowa gardeners the map is based on averages and minimum temperatures, used as guidelines to help select plants suitable for their location, and is not meant as set-in-stone rules.
"Longtime Iowa residents realize the weather in our state is rarely normal or average," Steil said in his analysis. "Periodically, these averages will be exceeded, sometimes by a wide margin. Plants may be damaged or destroyed during extreme weather events."
It's also important to remember that temperatures at a particular planting site can be influenced by many factors, such as sun, shade and protection from wind.
You can see an interactive version of the 2023 Plant Hardiness Zone Map at planthardiness.ars.usda.gov.
Kyle Werner is a reporter for the Register. Reach him at kwerner@dmreg.com.
This article originally appeared on Des Moines Register: USDA updates its Plant Hardiness Zone Map for Des Moines and Iowa

