The USDA Plant Hardiness Zone Map has been updated. Here's how it affects Duval County

The USDA (U.S. Department of Agriculture) released an updated Plant Hardiness Zone Map in mid-November. This map is used to determine which plants will likely survive the winter in a particular location.
The map divides the U.S. into thirteen zones, with each zone representing a 10-degree range of the average annual low temperature that an area can expect to see. Each zone is then divided further into five-degree increments.
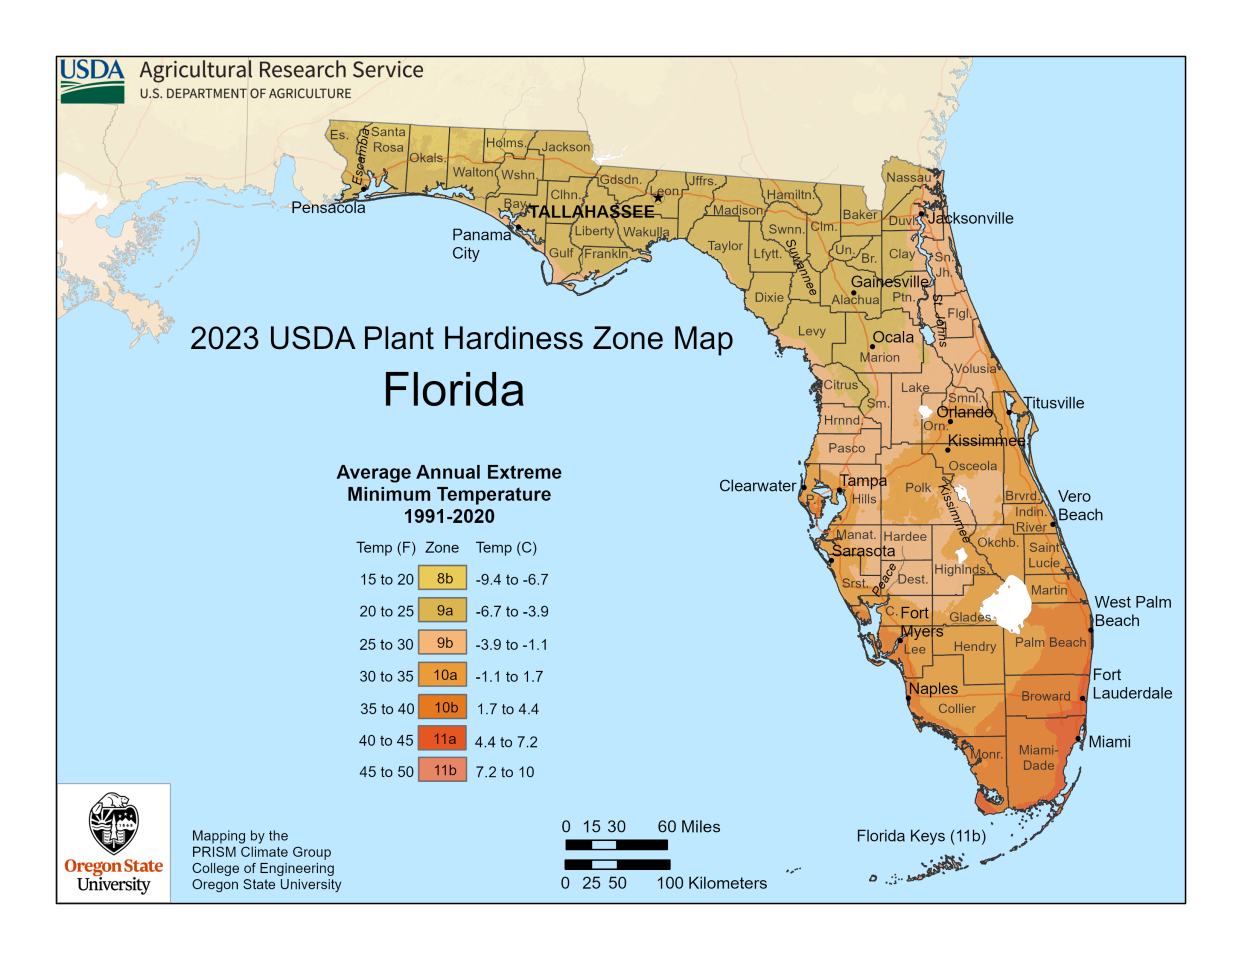
The most recent edition of the map until now was published in 2012 and put Duval County in Zone 9A. The average annual extreme low temperature for 9A is 20 to 25 degrees Fahrenheit. In the 2023 edition of the map, half of Duval has been bumped up to Zone 9B. This zone has an average expected extreme low temperature of 25 to 30 degrees Fahrenheit.
The area of the county inside the I-295 loop and nearly all areas to the east of the loop are now in 9B. The western side of the county outside of the loop and to the west of I-95 remains in zone 9A. Duval County is not the only area to see a zone shift. About half of the country is now placed a half zone warmer than they were in the 2012 map.
What caused this shift in the new map?
Mainly more accurate data collected over a long time. Data for the eastern half of the country mostly came from National Weather Service weather stations. The 2012 map used temperatures from 7,983 weather stations, and the update used data from 13,412 weather stations. It is easy to understand how almost twice the data can give much more accurate results.
The 2023 and 2012 versions of the map were based on 30 years of data, while an earlier version from 1990 used only 12 years of data. This 30-year period smooths out year-to-year fluctuations in temperatures and lines up with the time period that climatologists use to describe baseline “normal” climate in the U.S.
Why would only half of Duval County have a change?
There are a couple of reasons. The first is the urban heat island effect. Urban areas with a lot of concrete and asphalt covering the land have higher temperatures than the rural areas that surround them. The second reason would be the buffering effects of the Atlantic Ocean and the St. Johns River. Areas near large bodies of water tend to create a microclimate with slightly warmer temperatures. Even before the release of this map, serious gardeners in Duval already knew that they could “cheat the zone” and get slightly more tropical plants to survive the winter if they lived near downtown or out at the beach.
What does this mean for your garden?

This information is most useful as you decide what you want to plant in your landscape and whether it can survive the winter.
One important thing to note is that the map uses the average expected low temperature. That means that half the winters will not get to that lowest extreme temperature and the other half of our winters will get even colder than 20 to 25 degrees.
Plant researchers assign a hardiness zone range to plants based on this USDA map. For some of us in Duval, a whole new world of possibilities just opened to our landscapes.
Some notable zone 9B and warmer plants include avocado, jacaranda, jatropha, banana, tabebuia, ixora, bougainvillea, mandevilla, leatherleaf fern, and cardboard palm. Unfortunately, there are some favorites that are zoned 9A and cooler. Expect Eastern redbud, flowering dogwood, saucer magnolia, and mahonia to struggle if you live inside the loop or east towards the beach.
A long-term consideration is the risk for a plant to become invasive. The University of Florida has a website where you can look up plants to determine if they are invasive before you plant them at your home. (assessment.ifas.ufl.edu) Some plants may be rated invasive in the south or central region of the state, but only given a caution designation in the northern part of the state. As temperatures are trending warmer, plants that would normally be kept in check by cold winters may start adapting to warmer conditions and become a problem regarding invasiveness.
To check out the updated map for yourself, go to: planthardiness.ars.usda.gov. You can zoom in to see where your yard fits or use the Zip code search.
Tonya Ashworth is an extension agent and environmental horticulture and Master Gardener coordinator with UF/IFAS in Duval County.
This article originally appeared on Florida Times-Union: How the USDA Plant Hardiness Zone Map change affects Duval County

