Valmont Industries (NYSE:VMI) stock performs better than its underlying earnings growth over last three years
One simple way to benefit from the stock market is to buy an index fund. But if you pick the right individual stocks, you could make more than that. Just take a look at Valmont Industries, Inc. (NYSE:VMI), which is up 99%, over three years, soundly beating the market return of 20% (not including dividends). However, more recent returns haven't been as impressive as that, with the stock returning just 13% in the last year , including dividends .
Since the stock has added US$255m to its market cap in the past week alone, let's see if underlying performance has been driving long-term returns.
View our latest analysis for Valmont Industries
To quote Buffett, 'Ships will sail around the world but the Flat Earth Society will flourish. There will continue to be wide discrepancies between price and value in the marketplace...' One imperfect but simple way to consider how the market perception of a company has shifted is to compare the change in the earnings per share (EPS) with the share price movement.
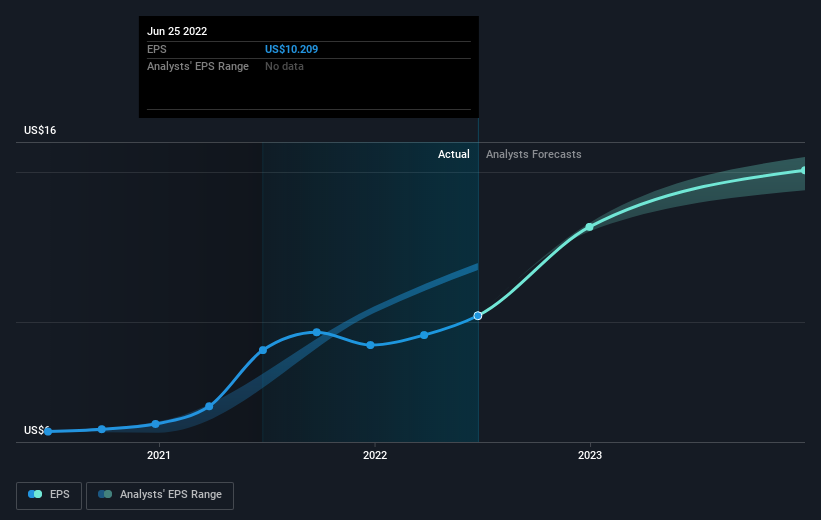
Valmont Industries was able to grow its EPS at 32% per year over three years, sending the share price higher. The average annual share price increase of 26% is actually lower than the EPS growth. So one could reasonably conclude that the market has cooled on the stock.
You can see how EPS has changed over time in the image below (click on the chart to see the exact values).
It is of course excellent to see how Valmont Industries has grown profits over the years, but the future is more important for shareholders. You can see how its balance sheet has strengthened (or weakened) over time in this free interactive graphic.
What About Dividends?
When looking at investment returns, it is important to consider the difference between total shareholder return (TSR) and share price return. The TSR incorporates the value of any spin-offs or discounted capital raisings, along with any dividends, based on the assumption that the dividends are reinvested. So for companies that pay a generous dividend, the TSR is often a lot higher than the share price return. As it happens, Valmont Industries' TSR for the last 3 years was 106%, which exceeds the share price return mentioned earlier. The dividends paid by the company have thusly boosted the total shareholder return.
A Different Perspective
It's nice to see that Valmont Industries shareholders have received a total shareholder return of 13% over the last year. Of course, that includes the dividend. That gain is better than the annual TSR over five years, which is 12%. Therefore it seems like sentiment around the company has been positive lately. Someone with an optimistic perspective could view the recent improvement in TSR as indicating that the business itself is getting better with time. While it is well worth considering the different impacts that market conditions can have on the share price, there are other factors that are even more important. Take risks, for example - Valmont Industries has 2 warning signs (and 1 which can't be ignored) we think you should know about.
If you would prefer to check out another company -- one with potentially superior financials -- then do not miss this free list of companies that have proven they can grow earnings.
Please note, the market returns quoted in this article reflect the market weighted average returns of stocks that currently trade on US exchanges.
Have feedback on this article? Concerned about the content? Get in touch with us directly. Alternatively, email editorial-team (at) simplywallst.com.
This article by Simply Wall St is general in nature. We provide commentary based on historical data and analyst forecasts only using an unbiased methodology and our articles are not intended to be financial advice. It does not constitute a recommendation to buy or sell any stock, and does not take account of your objectives, or your financial situation. We aim to bring you long-term focused analysis driven by fundamental data. Note that our analysis may not factor in the latest price-sensitive company announcements or qualitative material. Simply Wall St has no position in any stocks mentioned.
Join A Paid User Research Session
You’ll receive a US$30 Amazon Gift card for 1 hour of your time while helping us build better investing tools for the individual investors like yourself. Sign up here
