Value Screeners Identify Opportunities Ahead of 4th Quarter
In light of Apple Inc. (NASDAQ:AAPL), the top holding of Warren Buffett (Trades, Portfolio)'s Berkshire Hathaway Inc. (NYSE:BRK.A)(NYSE:BRK.B), launching its new line of products on Friday, GuruFocus' value screeners identified compelling investing opportunities for the final quarter of 2019.
Apple launches its new line of products around the globe
The Cupertino, California-based tech giant announced on its website its new products, which include the iPhone 11, iPhone 11 Pro and Apple Watch Series 5, arrived in its stores. CNBC columnist Elizabeth Schulze said crowds formed in cities like Singapore, Sydney, Berlin and London.
Apple CEO Tim Cook said the company's customers "are the center of everything [the company does]" and that the Fifth Avenue store, which reopened today, allows customers to get inspired by Apple's new products. Cook attended the reopening of the store and greeted the crowd.
Buffett indicator and Apple stock still near all-time high
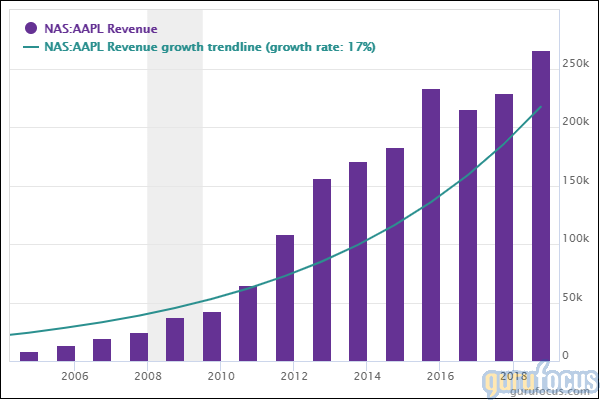
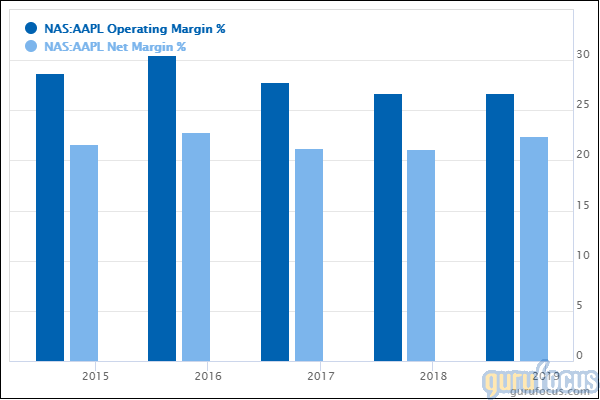
GuruFocus ranks Apple's profitability 9 out of 10 on several positive indicators, which include a strong Piotroski F-score of 7 and operating margins that outperform 95.37% of global competitors despite contracting approximately 1.9% per year on average over the past five years.
Apple's business predictability ranks 4.5 stars out of five on strong and consistent revenue and earnings growth. Despite this, the company is trading around $220 per share, approximately $43, or 16.38%, below its 10-year maximum price-sales valuation.

Buffett's favorite market indicator is also near its all-time high: The Wilshire 5000 full-cap price index is approximately 1.442 times greater than the last-reported U.S. gross domestic product, close to an all-time high of 1.485 times set in March 2000. Any total market cap to GDP multiple above 1.15 signals a significantly overvalued market. Based on this market valuation level, the expected market return over the next eight years is -2.10% per year assuming a reversion to the mean valuation level of 0.8 times GDP.
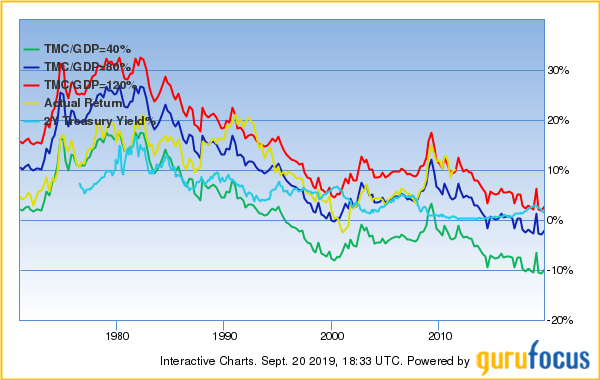
Table 1 lists the value screener record for the U.S., Asia and Europe regions as of Friday, while Table 2 lists the value screener record for the remaining regions.
Screener | USA | Asia | Europe |
Graham Net-Net | 137 | 517 | 180 |
Undervalued Predictable | 54 | 81 | 107 |
Buffett-Munger | 25 | 102 | 57 |
Historical Low PS | 62 | 118 | 62 |
Historical Low PB | 62 | 119 | 55 |
Peter Lynch Screen | 23 | 62 | 28 |
High Dividend Yield | 65 | 39 | 144 |
52-week Lows | 1492 | 3159 | 1414 |
52-week Highs | 2531 | 2121 | 2944 |
Table 1
Screener | Canada | UK/Ireland | Oceania | Latin America | Africa | India |
Graham Net-Net | 38 | 47 | 10 | 4 | 13 | 51 |
Undervalued Predictable | 7 | 48 | 4 | 50 | 5 | 18 |
Buffett-Munger | 3 | 27 | 0 | 16 | 4 | 48 |
Historical Low PS | 1 | 23 | 0 | 33 | 7 | 37 |
Historical Low PB | 0 | 29 | 2 | 37 | 7 | 42 |
Peter Lynch Screen | 0 | 17 | 0 | 2 | 3 | 18 |
High Dividend Yield | 7 | 16 | 5 | 19 | 10 | 12 |
52-week Lows | 116 | 523 | 60 | 393 | 146 | 1131 |
52-week Highs | 227 | 1066 | 210 | 594 | 109 | 383 |
Table 2
See also
The GuruFocus Premium membership gives access to various features, which include the Interactive Chart, the All-in-one Screener, GuruFocus Real-Time Picks, the Aggregated Portfolio and all of the above value screens. While our most-popular regions include the U.S., Asia and Europe, we provide our services around the globe through nine regions total.
Disclosure: No positions.
Read more here:
2 Companies With Higher Profitability Than Kraft Heinz
4 Outperforming Real Estate Companies With High Financial Strength
5 Residential Construction Companies Gurus Agree On
Not a Premium Member of GuruFocus? Sign up for a free 7-day trial here.
This article first appeared on GuruFocus.
