Value Screeners Identify Opportunities as Markets Rebound From March Lows
As markets attempt to rebound from a major tumble during March and April, investors might wonder where to start looking for good investing opportunities.
GuruFocus provides its Premium members with a wide range of value screens that apply teachings from several investing legends, including Benjamin Graham, Warren Buffett (Trades, Portfolio) and Peter Lynch.
U.S. market surges despite "historic" job losses in April
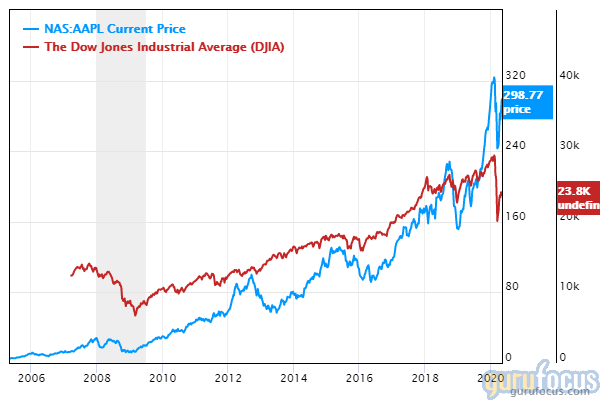
On Friday, the Dow Jones Industrial Average closed at 24,331.32, up 455.43 points or 1.91% from Thursday's close of 23,875.89 and 607.63 points or 2.56% from last Friday's close of 23,723.69. Apple Inc. (NASDAQ:AAPL), the top holding of Buffett's Berkshire Hathaway Inc. (NYSE:BRK.A)(NYSE:BRK.B) as of the December 2019 13-F filing, closed at $310.13, up 2.38% from the previous close.
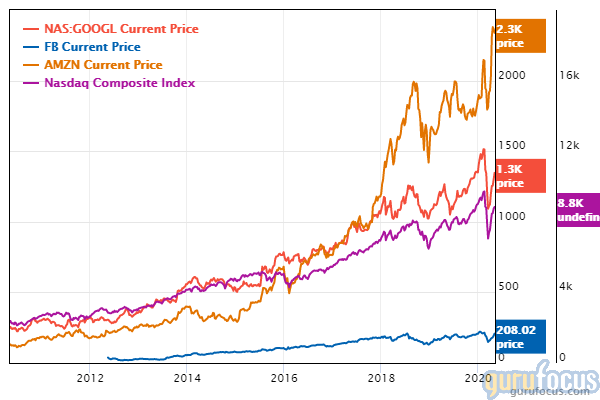
Gains from Apple and other stocks like Facebook Inc. (NASDAQ:FB), Amazon.com Inc. (NASDAQ:AMZN) and Google parent Alphabet Inc. (NASDAQ:GOOGL)(NASDAQ:GOOG) propelled the Nasdaq Composite Index above 9,000 for the first time since Feb. 24.
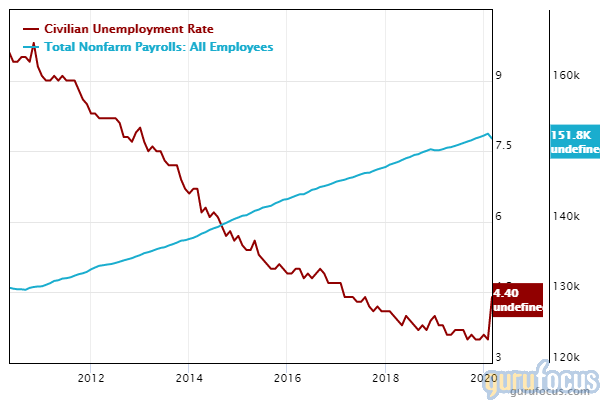
Stocks rallied despite nonfarm payrolls tumbling 20.5 million in April and the unemployment rate soaring to 14.7%, according to data from the U.S. Bureau of Labor Statistics. Even though these numbers represent new post-World War II records, the reported numbers still topped estimates: CNBC said that economists expected nonfarm payrolls to decline 21.5 million and the unemployment rate to eclipse 16%. MUFG Union Bank Chief Financial Economist Chris Rupkey added that "April might be it for job losses going forward" as the U.S. begins reopen the economy and that a "silver-lining" in Friday's report might be included in the "realization" that the economy might not be this weak going forward.
Value screeners seek opportunities
The following video discusses how to access our popular value screens, which include Ben Graham Net-Net, Undervalued-Predictable, Buffett-Munger and Peter Lynch.
Ben Graham Net-Net
As Figure 1 illustrates, the Ben Graham Net-Net screen applies the legendary investor's idea of investing in companies that are trading below net current asset value. Graham defined the net-net working capital as the sum of cash, 75% of accounts receivable and 50% of inventory minus total liabilities.

Figure 1
Graham also required positive operating cash flows and no meaningful debt: The investor set an interest coverage ratio threshold of at least five.
Table 1 lists the number of Ben Graham net-nets for each GuruFocus subscription region.
Region | U.S. | Asia | Europe | Canada | U.K. / Ireland | Oceania | Latin America | Africa | India |
Ben Graham Net-Net | 93 | 533 | 183 | 33 | 26 | 10 | 3 | 6 | 175 |
Table 1
Undervalued-Predictable and Buffett-Munger
As the name implies, the Undervalued-Predictable Screen seeks companies with high business predictability and are trading below intrinsic value based on the discounted cash flow and discounted earnings models. Figure 2 details the Undervalued-Predictable strategy.

Figure 2
Buffett and Berkshire co-manager Charlie Munger (Trades, Portfolio) take the undervalued-predictable strategy one notch further, requiring four key criteria: understandable business, favorable long-term prospects, competent management and attractive share price. Figure 3 further details the Buffett-Munger strategy.

Figure 3
Table 2 lists the number of undervalued-predictable and Buffett-Munger stocks for each GuruFocus subscription region.
Region | U.S. | Asia | Europe | Canada | U.K. / Ireland | Oceania | Latin America | Africa | India |
Undervalued Predictable | 64 | 190 | 214 | 7 | 88 | 10 | 67 | 5 | 43 |
Buffett-Munger | 27 | 142 | 104 | 1 | 47 | 3 | 36 | 4 | 42 |
Table 2
Peter Lynch
Peter Lynch, manager of the Fidelity Magellan Fund during the 1980s, developed a "quick" way to determine if a stock is undervalued or overvalued. The manager compared the company's price line to an earnings line based on a price-earnings ratio of 15. Figure 4 illustrates a sample Peter Lynch chart for Walmart Inc. (WMT).
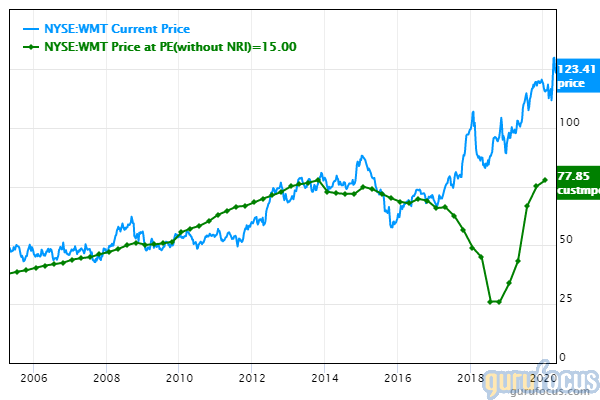
Figure 4
Table 3 lists the number of Peter Lynch stocks for each GuruFocus subscription region.
Region | U.S. | Asia | Europe | Canada | U.K. / Ireland | Oceania | Latin America | Africa | India |
Peter Lynch Screen | 50 | 91 | 71 | 0 | 25 | 0 | 12 | 5 | 14 |
Table 3
See also
Table 4 lists the screener record for the majority of the remaining value screens listed under the "Screeners" tab.
Region | U.S. | Asia | Europe | Canada | U.K. / Ireland | Oceania | Latin America | Africa | India |
Magic Formula | 4477 | 13398 | 8120 | 505 | 2568 | 531 | 1348 | 307 | 3494 |
Historical Low Price-Sales | 86 | 167 | 112 | 10 | 49 | 1 | 43 | 9 | 67 |
Historical Low Price-Book | 94 | 181 | 129 | 8 | 56 | 4 | 26 | 10 | 80 |
52-week Lows | 452 | 2145 | 864 | 31 | 415 | 25 | 442 | 117 | 806 |
52-week Highs | 701 | 1099 | 1236 | 77 | 438 | 42 | 557 | 46 | 249 |
High Dividend Yield | 130 | 76 | 202 | 11 | 23 | 17 | 25 | 15 | 29 |
Table 4
Disclosure: Author is long Apple.
Read more here:
Video: Warren Buffett's Market Indicator Rises Above 130%
Warren Buffett's Apple Falls as Company Skips June-Quarter Guidance
Video: Tracking Warren Buffett's Trades Using GURUG
Not a Premium Member of GuruFocus? Sign up for a free 7-day trial here.
This article first appeared on GuruFocus.
