What Is Van Elle Holdings's (LON:VANL) P/E Ratio After Its Share Price Tanked?

To the annoyance of some shareholders, Van Elle Holdings (LON:VANL) shares are down a considerable 41% in the last month. That drop has capped off a tough year for shareholders, with the share price down 36% in that time.
Assuming nothing else has changed, a lower share price makes a stock more attractive to potential buyers. While the market sentiment towards a stock is very changeable, in the long run, the share price will tend to move in the same direction as earnings per share. So, on certain occasions, long term focussed investors try to take advantage of pessimistic expectations to buy shares at a better price. One way to gauge market expectations of a stock is to look at its Price to Earnings Ratio (PE Ratio). Investors have optimistic expectations of companies with higher P/E ratios, compared to companies with lower P/E ratios.
See our latest analysis for Van Elle Holdings
Does Van Elle Holdings Have A Relatively High Or Low P/E For Its Industry?
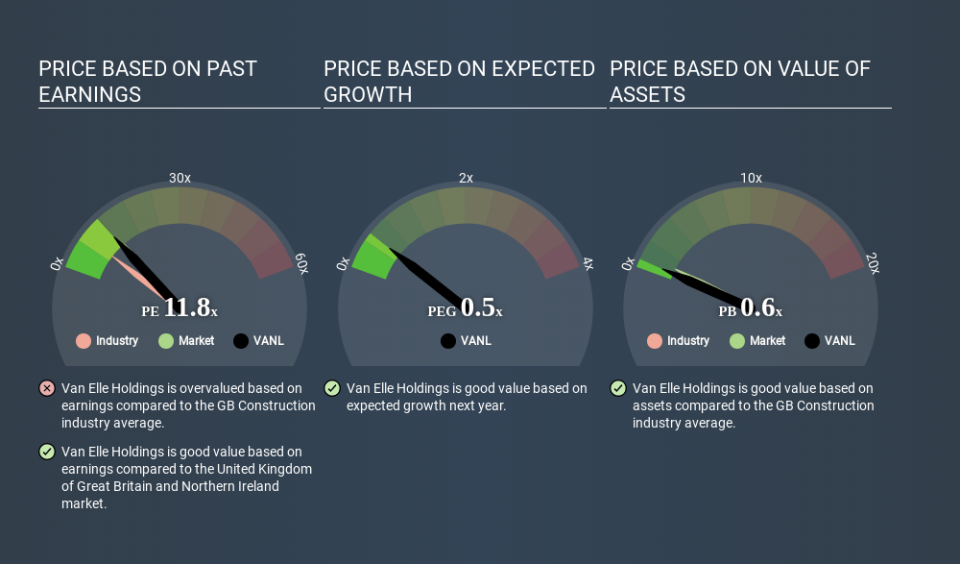
We can tell from its P/E ratio of 11.78 that there is some investor optimism about Van Elle Holdings. You can see in the image below that the average P/E (7.7) for companies in the construction industry is lower than Van Elle Holdings's P/E.
Van Elle Holdings's P/E tells us that market participants think the company will perform better than its industry peers, going forward. The market is optimistic about the future, but that doesn't guarantee future growth. So investors should delve deeper. I like to check if company insiders have been buying or selling.
How Growth Rates Impact P/E Ratios
If earnings fall then in the future the 'E' will be lower. That means even if the current P/E is low, it will increase over time if the share price stays flat. A higher P/E should indicate the stock is expensive relative to others -- and that may encourage shareholders to sell.
Van Elle Holdings saw earnings per share decrease by 58% last year. And EPS is down 58% a year, over the last 5 years. This could justify a pessimistic P/E.
Remember: P/E Ratios Don't Consider The Balance Sheet
The 'Price' in P/E reflects the market capitalization of the company. So it won't reflect the advantage of cash, or disadvantage of debt. The exact same company would hypothetically deserve a higher P/E ratio if it had a strong balance sheet, than if it had a weak one with lots of debt, because a cashed up company can spend on growth.
Such spending might be good or bad, overall, but the key point here is that you need to look at debt to understand the P/E ratio in context.
How Does Van Elle Holdings's Debt Impact Its P/E Ratio?
Since Van Elle Holdings holds net cash of UK£836k, it can spend on growth, justifying a higher P/E ratio than otherwise.
The Verdict On Van Elle Holdings's P/E Ratio
Van Elle Holdings's P/E is 11.8 which is about average (12.4) in the GB market. Although the recent drop in earnings per share would keep the market cautious, the relatively strong balance sheet will allow the company to weather a storm; so it isn't very surprising to see that it has a P/E ratio close to the market average. Given Van Elle Holdings's P/E ratio has declined from 19.9 to 11.8 in the last month, we know for sure that the market is significantly less confident about the business today, than it was back then. For those who don't like to trade against momentum, that could be a warning sign, but a contrarian investor might want to take a closer look.
Investors should be looking to buy stocks that the market is wrong about. If the reality for a company is not as bad as the P/E ratio indicates, then the share price should increase as the market realizes this. So this free report on the analyst consensus forecasts could help you make a master move on this stock.
Of course, you might find a fantastic investment by looking at a few good candidates. So take a peek at this free list of companies with modest (or no) debt, trading on a P/E below 20.
If you spot an error that warrants correction, please contact the editor at editorial-team@simplywallst.com. This article by Simply Wall St is general in nature. It does not constitute a recommendation to buy or sell any stock, and does not take account of your objectives, or your financial situation. Simply Wall St has no position in the stocks mentioned.
We aim to bring you long-term focused research analysis driven by fundamental data. Note that our analysis may not factor in the latest price-sensitive company announcements or qualitative material. Thank you for reading.

