Is Vardhman Holdings Limited’s (NSE:VHL) P/E Ratio Really That Good?

This article is written for those who want to get better at using price to earnings ratios (P/E ratios). We’ll look at Vardhman Holdings Limited’s (NSE:VHL) P/E ratio and reflect on what it tells us about the company’s share price. Based on the last twelve months, Vardhman Holdings’s P/E ratio is 4.36. That means that at current prices, buyers pay ₹4.36 for every ₹1 in trailing yearly profits.
See our latest analysis for Vardhman Holdings
How Do I Calculate A Price To Earnings Ratio?
The formula for P/E is:
Price to Earnings Ratio = Price per Share ÷ Earnings per Share (EPS)
Or for Vardhman Holdings:
P/E of 4.36 = ₹2285 ÷ ₹523.58 (Based on the year to December 2018.)
Is A High Price-to-Earnings Ratio Good?
A higher P/E ratio implies that investors pay a higher price for the earning power of the business. That isn’t a good or a bad thing on its own, but a high P/E means that buyers have a higher opinion of the business’s prospects, relative to stocks with a lower P/E.
How Growth Rates Impact P/E Ratios
Probably the most important factor in determining what P/E a company trades on is the earnings growth. Earnings growth means that in the future the ‘E’ will be higher. That means even if the current P/E is high, it will reduce over time if the share price stays flat. So while a stock may look expensive based on past earnings, it could be cheap based on future earnings.
Vardhman Holdings’s earnings per share fell by 51% in the last twelve months. But it has grown its earnings per share by 58% per year over the last five years.
How Does Vardhman Holdings’s P/E Ratio Compare To Its Peers?
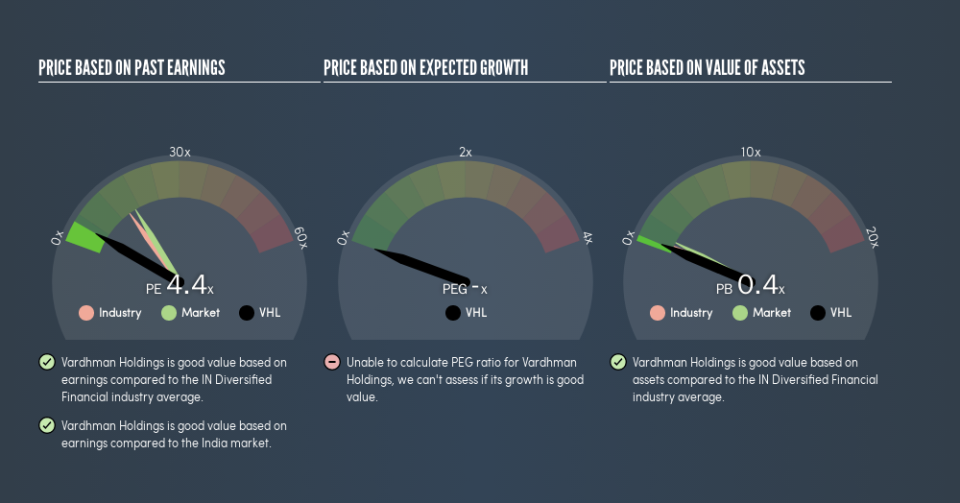
The P/E ratio indicates whether the market has higher or lower expectations of a company. If you look at the image below, you can see Vardhman Holdings has a lower P/E than the average (14.6) in the diversified financial industry classification.
Vardhman Holdings’s P/E tells us that market participants think it will not fare as well as its peers in the same industry. Since the market seems unimpressed with Vardhman Holdings, it’s quite possible it could surprise on the upside. You should delve deeper. I like to check if company insiders have been buying or selling.
Don’t Forget: The P/E Does Not Account For Debt or Bank Deposits
The ‘Price’ in P/E reflects the market capitalization of the company. In other words, it does not consider any debt or cash that the company may have on the balance sheet. In theory, a company can lower its future P/E ratio by using cash or debt to invest in growth.
Spending on growth might be good or bad a few years later, but the point is that the P/E ratio does not account for the option (or lack thereof).
How Does Vardhman Holdings’s Debt Impact Its P/E Ratio?
Since Vardhman Holdings holds net cash of ₹2.0b, it can spend on growth, justifying a higher P/E ratio than otherwise.
The Verdict On Vardhman Holdings’s P/E Ratio
Vardhman Holdings has a P/E of 4.4. That’s below the average in the IN market, which is 16.5. The recent drop in earnings per share would make investors cautious, but the net cash position means the company has time to improve: if so, the low P/E could be an opportunity.
Investors should be looking to buy stocks that the market is wrong about. If the reality for a company is not as bad as the P/E ratio indicates, then the share price should increase as the market realizes this. Although we don’t have analyst forecasts, you could get a better understanding of its growth by checking out this more detailed historical graph of earnings, revenue and cash flow.
Of course you might be able to find a better stock than Vardhman Holdings. So you may wish to see this free collection of other companies that have grown earnings strongly.
We aim to bring you long-term focused research analysis driven by fundamental data. Note that our analysis may not factor in the latest price-sensitive company announcements or qualitative material.
If you spot an error that warrants correction, please contact the editor at editorial-team@simplywallst.com. This article by Simply Wall St is general in nature. It does not constitute a recommendation to buy or sell any stock, and does not take account of your objectives, or your financial situation. Simply Wall St has no position in the stocks mentioned. Thank you for reading.
