Vermont's heat and energy landscape over the past decade
Vermont endured its first hot spell of the summer the first week of July, with heat advisories issued around the state. Burlington had three consecutive days breaking 90 degrees – a heat wave by the National Weather Service's definition.
The statewide temperature spike coincided with heat waves around the globe. In the same week, the global temperature was the hottest ever recorded, with an average temperature of 63 degrees Fahrenheit.
The following week saw weather advisories of a different variety − heavy rains that caused massive flooding and sever damage around the state − pointing to a rapidly changing climate.
More: Catastrophic flooding in VT 'Irene-like' storm expected to dump half a foot of rain, causing widespread flooding
Vermont is a wet continental climate, meaning it experiences cold winters, and hot summers. With precipitation year round, summers in Vermont often mean a great increase in humidity.
Vermont’s latest climate assessment conducted in 2021 shows a statewide average annual temperature increase of almost 2 degrees Fahrenheit since 1900, and an increase in average winter temperatures at a rate 2.5 times that of the average annual temperature increase.
How hot have Vermont summers been in the past decade and what has that meant in terms of energy use?
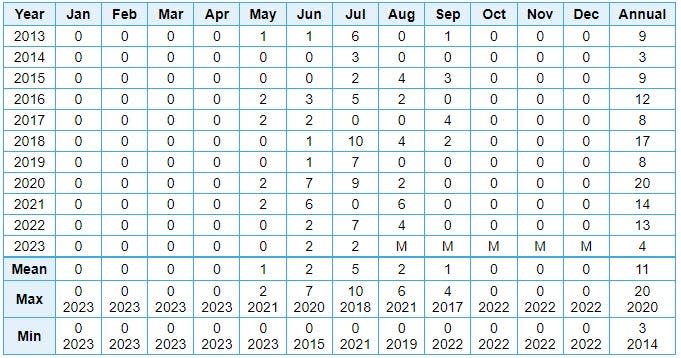
Days over 90 degrees in Burlington from 2013-2023
So far in 2023, Vermont has had four days over 90 degrees. Typically, summer heat in Vermont picks up in the latter half of July and through August. On June 15, the National Weather Service Climate Prediction Center and Oceanic and National Atmospheric Administration issued a seasonal temperature outlook, showing the probability of average temperatures exceeding averages from prior years.

Vermont – and much of New England – was projected to “lean above” normal temperatures this summer, with 40-50% probability.
Burlington’s hottest summer on record in the past 10 years was 2020, ranking 3rd behind 1944 and 1949, which respectively take first and second place in all time highs. In 2020, Vermont had 20 days over 90 degrees and three heat waves, all in July. The longest heat wave in 2020 lasted 6 days. The other two lasted for 3 days.
The National Weather Service defines a heat wave as at least 3 consecutive days where each day has a high temperature of 90 degrees or higher.
Following 2020, the next summer with the highest number of days over 90 degrees was 2018 with 17 days, then 2021 (14 days), and 2022 (13 days).
From 2018 to 2022, the number of days over 90 degrees has stayed in the 10-20 day range.
The effects of heat on the body
The National Weather Services uses the Wet Bulb Globe Temperature to show bodily effects of environmental heat stress in their areas, so people protect themselves from experiencing heat-related illnesses during hot periods.
Wet Bulb Globe Temperature (WGBT) is a measurement taken from a thermometer covered in a wet cloth, which mimics how the body sweats to cool itself, a black globe which measures solar radiation, and a dry bulb which calculates air temperature in the shade. The WBGT accounts for heat stress in direct sunlight taking into account temperature, humidity, wind-speed, and sun-angle.
On a rainy day such as July 10, when the high is 72 degrees with 96% humidity, the Wet Bulb Globe Temperature index places people at low to elevated threat. Proposed activity guidelines in these conditions say to resume normal activities while monitoring fluid intake. This warning which may come at a seemingly non-threatening temperature likely considers humidity as the particularly threatening factor.
If the high was 10 degrees higher, the threat of heat stress would be high, with a suggestion to limit exercise and total daily exposure to heat and humidity. At 84 degrees or above on a day with July 10 humidity levels, all exercise should be canceled to avoid going into heat stress.
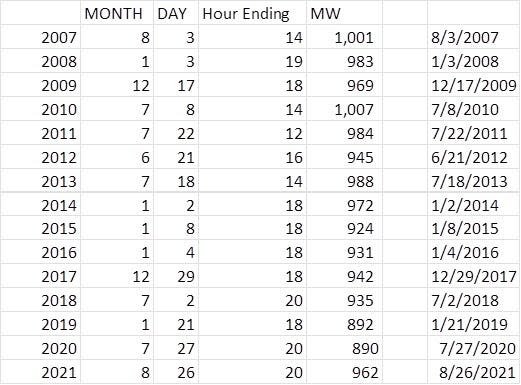
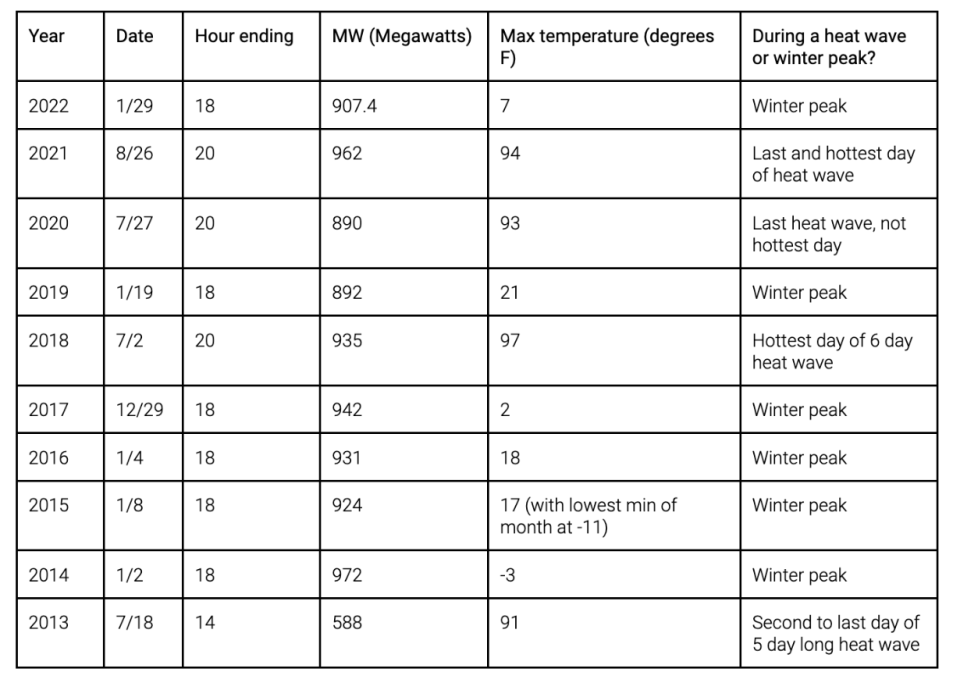
Vermont peak energy days from 2013-2021
The annual peak energy loads in Vermont dictate the formula used to calculate the transmission cost for that year, which are the fees associated with energy moving through the grid. This means the charges are demand-based, factored by the peak energy load in accordance with the ISO-NE’s total demand. The ISO-NE is a Regional Transmission Organization that is in charge of New England's bulk electric power system and transmission lines, dispatching electricity based on hourly energy use as managed at Local Control Centers.
Vermont used to be a state whose energy loads consistently peaked during winter months. In recent years the state energy loads have peaked just as frequently during the summer. Vermont saw peak energy loads in the summer of 2020 and 2021, when peak energy loads occurred during heat waves. The years 2022 and 2019, as well as 2014-2017 all had winter peak energy load dates.
Winter temperatures in Vermont have increased 2.5 times faster than Vermont’s average annual temperature in 60 years, according to the 2021 climate assessment. The freeze-free period has grown by three weeks. The number of very cold nights – nights where the minimum temperature is below 0 – has decreased by 0.6 days per decade since 1900.
Peak energy loads falling less consistently in the winter and more frequently in the summer reflects the broader trends of Vermont winters warming more rapidly than the average annual temperature.
For the last 10 years, peak energy loads have been either between 7 p.m. and 8 p.m. or 5 p.m. and 6 p.m.
Contact Kate Sadoff at ksadoff@gannett.com.
This article originally appeared on Burlington Free Press: Vermont heat data and energy peak load data of the past 10 years

