Vibrant Group Limited (SGX:BIP) Is Employing Capital Very Effectively

Want to participate in a short research study? Help shape the future of investing tools and you could win a $250 gift card!
Today we'll look at Vibrant Group Limited (SGX:BIP) and reflect on its potential as an investment. To be precise, we'll consider its Return On Capital Employed (ROCE), as that will inform our view of the quality of the business.
First, we'll go over how we calculate ROCE. Second, we'll look at its ROCE compared to similar companies. Last but not least, we'll look at what impact its current liabilities have on its ROCE.
Understanding Return On Capital Employed (ROCE)
ROCE is a measure of a company's yearly pre-tax profit (its return), relative to the capital employed in the business. All else being equal, a better business will have a higher ROCE. Ultimately, it is a useful but imperfect metric. Renowned investment researcher Michael Mauboussin has suggested that a high ROCE can indicate that 'one dollar invested in the company generates value of more than one dollar'.
How Do You Calculate Return On Capital Employed?
Analysts use this formula to calculate return on capital employed:
Return on Capital Employed = Earnings Before Interest and Tax (EBIT) ÷ (Total Assets - Current Liabilities)
Or for Vibrant Group:
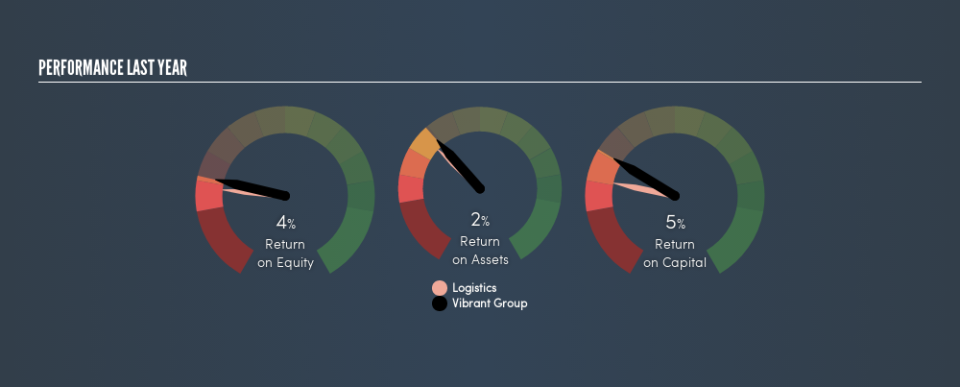
0.05 = S$21m ÷ (S$723m - S$301m) (Based on the trailing twelve months to April 2019.)
So, Vibrant Group has an ROCE of 5.0%.
View our latest analysis for Vibrant Group
Does Vibrant Group Have A Good ROCE?
When making comparisons between similar businesses, investors may find ROCE useful. In our analysis, Vibrant Group's ROCE is meaningfully higher than the 1.8% average in the Logistics industry. I think that's good to see, since it implies the company is better than other companies at making the most of its capital. Putting aside Vibrant Group's performance relative to its industry, its ROCE in absolute terms is poor - considering the risk of owning stocks compared to government bonds. There are potentially more appealing investments elsewhere.
In our analysis, Vibrant Group's ROCE appears to be 5.0%, compared to 3 years ago, when its ROCE was 2.6%. This makes us wonder if the company is improving. You can click on the image below to see (in greater detail) how Vibrant Group's past growth compares to other companies.
It is important to remember that ROCE shows past performance, and is not necessarily predictive. ROCE can be misleading for companies in cyclical industries, with returns looking impressive during the boom times, but very weak during the busts. ROCE is only a point-in-time measure. If Vibrant Group is cyclical, it could make sense to check out this free graph of past earnings, revenue and cash flow.
Vibrant Group's Current Liabilities And Their Impact On Its ROCE
Current liabilities include invoices, such as supplier payments, short-term debt, or a tax bill, that need to be paid within 12 months. The ROCE equation subtracts current liabilities from capital employed, so a company with a lot of current liabilities appears to have less capital employed, and a higher ROCE than otherwise. To counter this, investors can check if a company has high current liabilities relative to total assets.
Vibrant Group has total assets of S$723m and current liabilities of S$301m. Therefore its current liabilities are equivalent to approximately 42% of its total assets. With a medium level of current liabilities boosting the ROCE a little, Vibrant Group's low ROCE is unappealing.
Our Take On Vibrant Group's ROCE
This company may not be the most attractive investment prospect. Of course, you might also be able to find a better stock than Vibrant Group. So you may wish to see this free collection of other companies that have grown earnings strongly.
If you are like me, then you will not want to miss this free list of growing companies that insiders are buying.
We aim to bring you long-term focused research analysis driven by fundamental data. Note that our analysis may not factor in the latest price-sensitive company announcements or qualitative material.
If you spot an error that warrants correction, please contact the editor at editorial-team@simplywallst.com. This article by Simply Wall St is general in nature. It does not constitute a recommendation to buy or sell any stock, and does not take account of your objectives, or your financial situation. Simply Wall St has no position in the stocks mentioned. Thank you for reading.

