Is Vidrala, S.A.'s (BME:VID) Balance Sheet A Threat To Its Future?

Want to participate in a short research study? Help shape the future of investing tools and you could win a $250 gift card!
Small-cap and large-cap companies receive a lot of attention from investors, but mid-cap stocks like Vidrala, S.A. (BME:VID), with a market cap of €2.1b, are often out of the spotlight. However, generally ignored mid-caps have historically delivered better risk adjusted returns than both of those groups. VID’s financial liquidity and debt position will be analysed in this article, to get an idea of whether the company can fund opportunities for strategic growth and maintain strength through economic downturns. Don’t forget that this is a general and concentrated examination of Vidrala’s financial health, so you should conduct further analysis into VID here.
See our latest analysis for Vidrala
VID’s Debt (And Cash Flows)
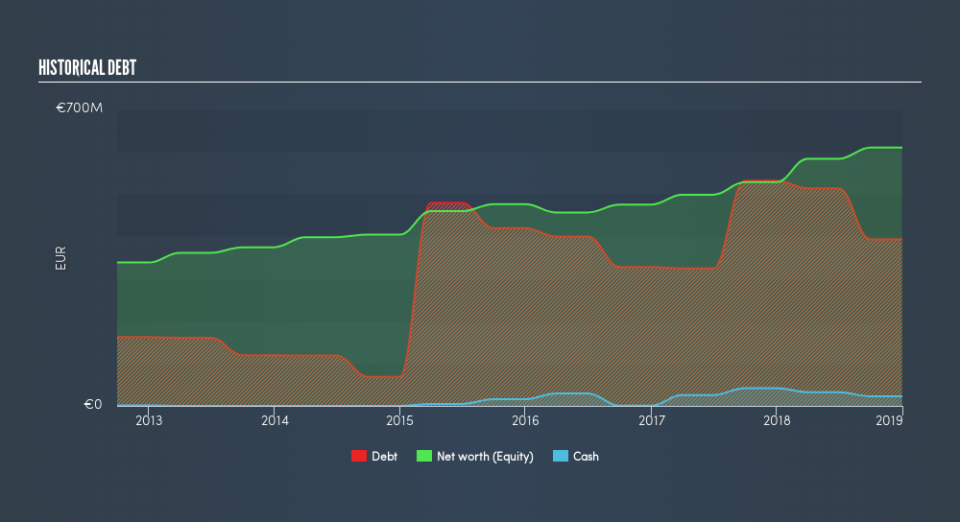
Over the past year, VID has reduced its debt from €532m to €434m , which includes long-term debt. With this debt repayment, the current cash and short-term investment levels stands at €23m , ready to be used for running the business. Moreover, VID has generated cash from operations of €203m in the last twelve months, resulting in an operating cash to total debt ratio of 47%, signalling that VID’s operating cash is sufficient to cover its debt.
Can VID pay its short-term liabilities?
Looking at VID’s €302m in current liabilities, it seems that the business has been able to meet these obligations given the level of current assets of €449m, with a current ratio of 1.49x. The current ratio is the number you get when you divide current assets by current liabilities. For Packaging companies, this ratio is within a sensible range since there is a bit of a cash buffer without leaving too much capital in a low-return environment.
Can VID service its debt comfortably?
VID is a relatively highly levered company with a debt-to-equity of 71%. This is not uncommon for a mid-cap company given that debt tends to be lower-cost and at times, more accessible. We can check to see whether VID is able to meet its debt obligations by looking at the net interest coverage ratio. A company generating earnings before interest and tax (EBIT) at least three times its net interest payments is considered financially sound. In VID's, case, the ratio of 22.2x suggests that interest is comfortably covered, which means that lenders may be inclined to lend more money to the company, as it is seen as safe in terms of payback.
Next Steps:
Although VID’s debt level is towards the higher end of the spectrum, its cash flow coverage seems adequate to meet obligations which means its debt is being efficiently utilised. Since there is also no concerns around VID's liquidity needs, this may be its optimal capital structure for the time being. I admit this is a fairly basic analysis for VID's financial health. Other important fundamentals need to be considered alongside. I suggest you continue to research Vidrala to get a more holistic view of the mid-cap by looking at:
Future Outlook: What are well-informed industry analysts predicting for VID’s future growth? Take a look at our free research report of analyst consensus for VID’s outlook.
Valuation: What is VID worth today? Is the stock undervalued, even when its growth outlook is factored into its intrinsic value? The intrinsic value infographic in our free research report helps visualize whether VID is currently mispriced by the market.
Other High-Performing Stocks: Are there other stocks that provide better prospects with proven track records? Explore our free list of these great stocks here.
We aim to bring you long-term focused research analysis driven by fundamental data. Note that our analysis may not factor in the latest price-sensitive company announcements or qualitative material.
If you spot an error that warrants correction, please contact the editor at editorial-team@simplywallst.com. This article by Simply Wall St is general in nature. It does not constitute a recommendation to buy or sell any stock, and does not take account of your objectives, or your financial situation. Simply Wall St has no position in the stocks mentioned. Thank you for reading.

