How Volatility Could Predict the S&P's Next Move
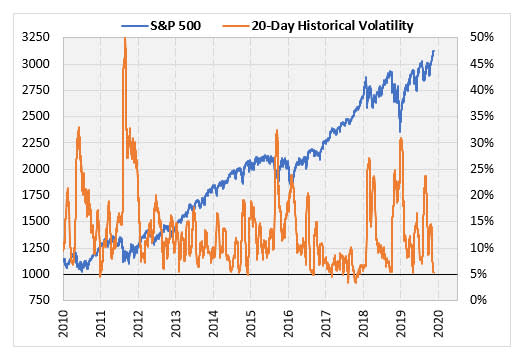
The S&P 500 Index (SPX) has been grinding higher for several weeks now. With the slow grind, the 20-day historical volatility (HV) is on the verge of falling below 5% -- a rare feat. Low volatility usually corresponds to positive returns, and with the S&P 500 up six straight weeks, this time is no different. This week I'll look at past instances when we hit these extremely low volatility levels and see how stocks performed going forward.
HV Drops Below 5%
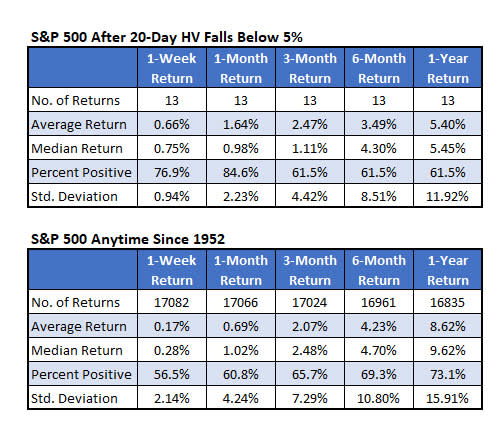
The table below shows how the S&P 500 has done after its 20-day HV falls below 5% for the first time in at least a year. It has happened 13 other times since 1928 (as far back as we have S&P 500 data), with the first signal in 1952. The data suggests strong returns over the short term. In these 13 instances, the index gained an average of 1.64% over the next month with 85% of the returns positive. The S&P 500 has typically gained about 0.7% over that time frame with a roughly 61% probability of a positive return.
Looking past that, however, these signals show returns that underperform the market. Looking at the six-month and one-year returns, the average return and percent positive are both lower than what the market has typically done. Based on these 13 occurrences, volatility is expected to stay depressed.
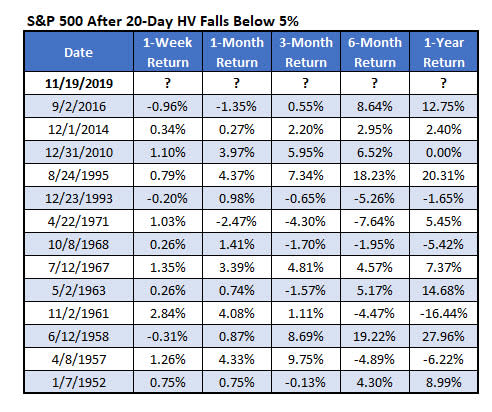
For those curious, the table below shows each of the signals in the data above. Interestingly, the last signal from September 2016 showed stocks behaved the opposite as to what has been normal after these signals. The S&P 500 fell 1.35% over the next month but was up almost 13% over the next year.
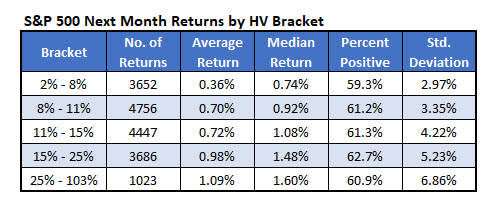
Returns by HV Bracket
Here's another way I looked at it. I went back to 1950 and found how stocks performed over the next month based on the HV reading. It's a very general way of looking at it. The results were interesting but not good. When the HV was between 2% and 8%, the S&P 500 gained an average of 0.36% over the next month, which is the lowest of the five brackets. The percent positive is also the lowest in this extreme low volatility bracket, which surprised me. In fact, looking at the table below, it seems stocks are better the higher the HV reading. The outperformance is, however, at the expense of higher volatility. The standard deviation of returns going forward has been higher when the HV has been higher.