Is Volga Gas plc's (LON:VGAS) Capital Allocation Ability Worth Your Time?

Today we'll evaluate Volga Gas plc (LON:VGAS) to determine whether it could have potential as an investment idea. Specifically, we're going to calculate its Return On Capital Employed (ROCE), in the hopes of getting some insight into the business.
Firstly, we'll go over how we calculate ROCE. Second, we'll look at its ROCE compared to similar companies. And finally, we'll look at how its current liabilities are impacting its ROCE.
What is Return On Capital Employed (ROCE)?
ROCE is a measure of a company's yearly pre-tax profit (its return), relative to the capital employed in the business. Generally speaking a higher ROCE is better. In brief, it is a useful tool, but it is not without drawbacks. Author Edwin Whiting says to be careful when comparing the ROCE of different businesses, since 'No two businesses are exactly alike.
How Do You Calculate Return On Capital Employed?
The formula for calculating the return on capital employed is:
Return on Capital Employed = Earnings Before Interest and Tax (EBIT) ÷ (Total Assets - Current Liabilities)
Or for Volga Gas:
0.091 = US$5.1m ÷ (US$62m - US$5.8m) (Based on the trailing twelve months to June 2019.)
So, Volga Gas has an ROCE of 9.1%.
View our latest analysis for Volga Gas
Does Volga Gas Have A Good ROCE?
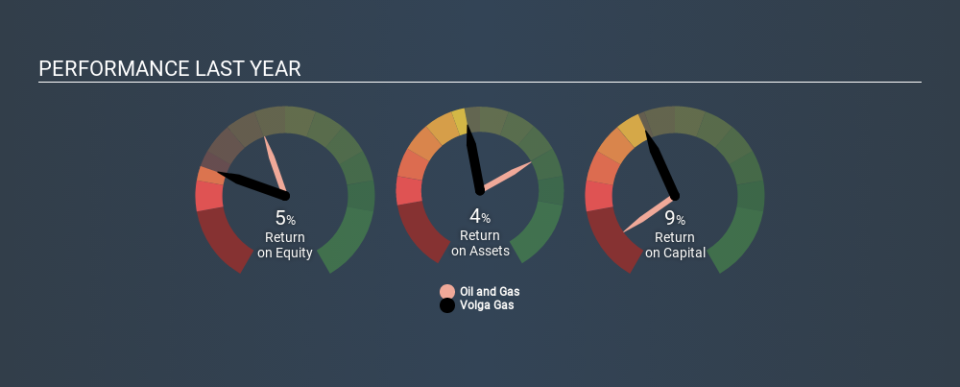
ROCE is commonly used for comparing the performance of similar businesses. We can see Volga Gas's ROCE is around the 10% average reported by the Oil and Gas industry. Regardless of where Volga Gas sits next to its industry, its ROCE in absolute terms appears satisfactory, and this company could be worth a closer look.
Volga Gas delivered an ROCE of 9.1%, which is better than 3 years ago, as was making losses back then. That suggests the business has returned to profitability. You can see in the image below how Volga Gas's ROCE compares to its industry. Click to see more on past growth.
It is important to remember that ROCE shows past performance, and is not necessarily predictive. Companies in cyclical industries can be difficult to understand using ROCE, as returns typically look high during boom times, and low during busts. This is because ROCE only looks at one year, instead of considering returns across a whole cycle. Remember that most companies like Volga Gas are cyclical businesses. If Volga Gas is cyclical, it could make sense to check out this free graph of past earnings, revenue and cash flow.
Volga Gas's Current Liabilities And Their Impact On Its ROCE
Current liabilities are short term bills and invoices that need to be paid in 12 months or less. Due to the way ROCE is calculated, a high level of current liabilities makes a company look as though it has less capital employed, and thus can (sometimes unfairly) boost the ROCE. To counteract this, we check if a company has high current liabilities, relative to its total assets.
Volga Gas has total assets of US$62m and current liabilities of US$5.8m. As a result, its current liabilities are equal to approximately 9.4% of its total assets. With low current liabilities, Volga Gas's decent ROCE looks that much more respectable.
What We Can Learn From Volga Gas's ROCE
If Volga Gas can continue reinvesting in its business, it could be an attractive prospect. Volga Gas looks strong on this analysis, but there are plenty of other companies that could be a good opportunity . Here is a free list of companies growing earnings rapidly.
If you are like me, then you will not want to miss this free list of growing companies that insiders are buying.
If you spot an error that warrants correction, please contact the editor at editorial-team@simplywallst.com. This article by Simply Wall St is general in nature. It does not constitute a recommendation to buy or sell any stock, and does not take account of your objectives, or your financial situation. Simply Wall St has no position in the stocks mentioned.
We aim to bring you long-term focused research analysis driven by fundamental data. Note that our analysis may not factor in the latest price-sensitive company announcements or qualitative material. Thank you for reading.

