Warren Buffett's Market Indicator Falls Near 3-Year Low
On Wednesday, "April Fool's Day," Berkshire Hathaway Inc. (NYSE:BRK.A)(NYSE:BRK.B) CEO Warren Buffett (Trades, Portfolio)'s favorite market indicator stood at 113.6%, up 2.1% from the March 16 level of 111.5% yet down 25% from the March 3 level of 138.6%. More importantly, the ratio of total market cap to gross domestic product tumbled 41.1% from the all-time high of 154.7% set during the first two months of 2020 as coronavirus fears rattled markets during March.
Dow starts the second quarter with a bust as Covid-19 spread accelerates
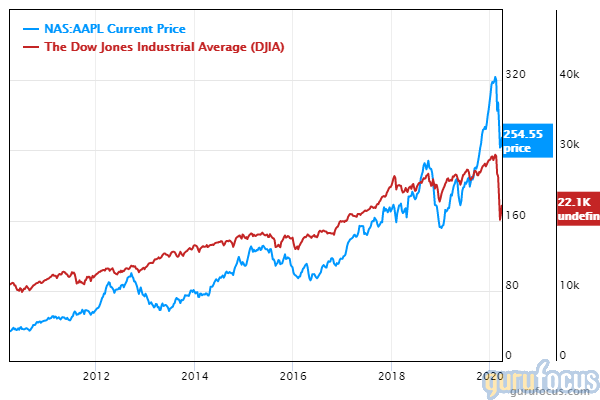
The Dow Jones Industrial Average closed at 20,943.51, down 973.65 points or 4.44% from Tuesday's close of 21,917.16. Apple Inc. (NASDAQ:AAPL), the top holding of Berkshire, tumbled over 5% for the day.
According to John Hopkins University statistics, coronavirus cases topped 900,000 around the globe, with over 200,000 cases in the U.S., doubling since last Friday. CNBC added that the acceleration of cases in the U.S. stems from "broader testing" and outbreaks in major cities around the country.
Stocks tumbled on President Trump's comments during a White House press conference on Tuesday that the number of virus casualties could reach at least 100,000 over the next two to three weeks despite Trump "wanting as few as a number of people to die as possible."
Other stocks contributing to the Dow's decline included Boeing Co. (NYSE:BA), American Express Co. (NYSE:AXP) and Dow Inc. (NYSE:DOW).
Markets are coming off a volatile March
Figure 1 illustrates the Dow's daily change since February 2020, where the 30-stock index started falling from its Feb. 12 record of 29,551.42.

Figure 1
As Figure 1 illustrates, the Dow changes started fluctuating massively during March, with multiple days featuring a four-digit change in either direction. The daily changes ranged between -2,997.1 and 2,112.98, representing a percentage decline of close to 15% and a percentage increase of at least 10%.
Buffett indicator tumbles near three-year low
According to Buffett's market indicator, the Wilshire 5000 full-cap market index is 113.6% higher than the U.S. gross domestic product, suggesting a modestly overvalued stock market. Based on this market valuation level, the expected market return per year over the next eight years is 1.90%, assuming a reversion to the mean market valuation ratio of 80%.
The predefined and actual returns chart considers a few scenarios, including a pessimistic case where the total market cap averages around 40% of gross domestic product and an optimistic case where the total market cap averages around 120% of gross domestic product during the next eight years. According to the chart, the expected annual return ranges from -6.10% per year in the pessimistic case and 6.80% per year in the optimistic case.
Shiller price-earnings ratio gives a second perspective on market valuations
Yale Professor Robert Shiller measures market valuations using a cyclically-adjusted price-earnings ratio. Based on a Shiller price-earnings ratio of 23.7, which is 39.40% higher than the historical mean of 17, the implied future annual return is 2.1% per year.
Chief financial officer buy-sell ratios reach five-year high
As the markets tumble near three-year lows, the buy-sell ratio among company chief financial officers has reached 1.47 in March, close to a five-year high.

Premium members have access to wide range of value screeners and tools for investing research, including insider buys, guru-insider double buys and much more.
Disclosure: The author is long Apple.
Read more here:
5 Energy Companies With the Strength to Weather the Coronavirus Storm
6 High Financial Strength Stocks John Rogers and Paul Tudor Jones Agree On
4 Profitable and Predictable Stocks to Combat Market Volatility
Not a Premium Member of GuruFocus? Sign up for a free 7-day trial here.
This article first appeared on GuruFocus.
