We're Hopeful That Opthea (ASX:OPT) Will Use Its Cash Wisely

Even when a business is losing money, it's possible for shareholders to make money if they buy a good business at the right price. By way of example, Opthea (ASX:OPT) has seen its share price rise 455% over the last year, delighting many shareholders. But while history lauds those rare successes, those that fail are often forgotten; who remembers Pets.com?
Given its strong share price performance, we think it's worthwhile for Opthea shareholders to consider whether its cash burn is concerning. For the purposes of this article, cash burn is the annual rate at which an unprofitable company spends cash to fund its growth; its negative free cash flow. The first step is to compare its cash burn with its cash reserves, to give us its 'cash runway'.
See our latest analysis for Opthea
When Might Opthea Run Out Of Money?
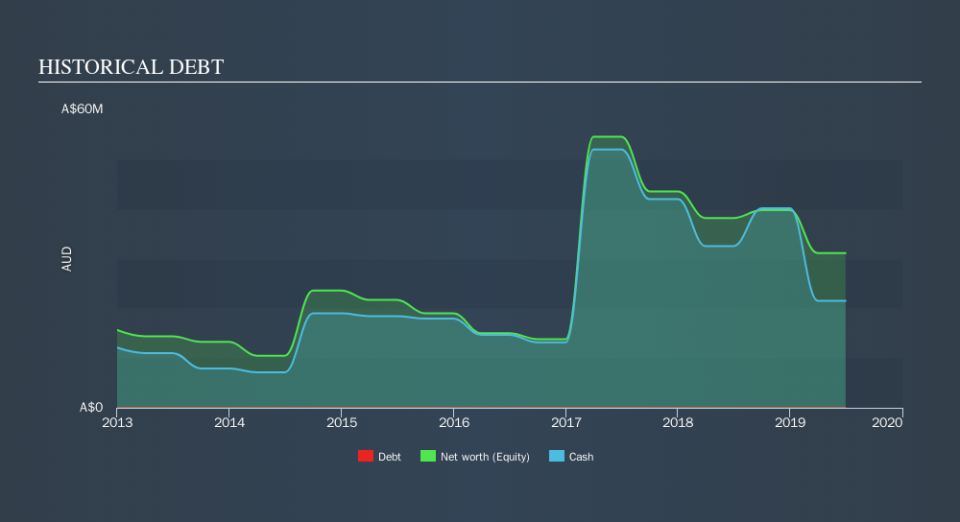
A cash runway is defined as the length of time it would take a company to run out of money if it kept spending at its current rate of cash burn. When Opthea last reported its balance sheet in June 2019, it had zero debt and cash worth AU$22m. In the last year, its cash burn was AU$24m. That means it had a cash runway of around 11 months as of June 2019. Notably, analysts forecast that Opthea will break even (at a free cash flow level) in about 12 months. So there's a very good chance it won't need more cash, when you consider the burn rate will be reducing in that period. You can see how its cash balance has changed over time in the image below.
How Is Opthea's Cash Burn Changing Over Time?
Although Opthea reported revenue of AU$240k last year, it didn't actually have any revenue from operations. That means we consider it a pre-revenue business, and we will focus our growth analysis on cash burn, for now. With the cash burn rate up 21% in the last year, it seems that the company is ratcheting up investment in the business over time. However, the company's true cash runway will therefore be shorter than suggested above, if spending continues to increase. While the past is always worth studying, it is the future that matters most of all. So you might want to take a peek at how much the company is expected to grow in the next few years.
How Hard Would It Be For Opthea To Raise More Cash For Growth?
Since its cash burn is moving in the wrong direction, Opthea shareholders may wish to think ahead to when the company may need to raise more cash. Companies can raise capital through either debt or equity. One of the main advantages held by publicly listed companies is that they can sell shares to investors to raise cash to fund growth. By comparing a company's annual cash burn to its total market capitalisation, we can estimate roughly how many shares it would have to issue in order to run the company for another year (at the same burn rate).
Since it has a market capitalisation of AU$863m, Opthea's AU$24m in cash burn equates to about 2.8% of its market value. So it could almost certainly just borrow a little to fund another year's growth, or else easily raise the cash by issuing a few shares.
Is Opthea's Cash Burn A Worry?
It may already be apparent to you that we're relatively comfortable with the way Opthea is burning through its cash. In particular, we think its cash burn relative to its market cap stands out as evidence that the company is well on top of its spending. While its cash runway wasn't great, the other factors mentioned in this article more than make up for weakness on that measure. It's clearly very positive to see that analysts are forecasting the company will break even fairly soon After taking into account the various metrics mentioned in this report, we're pretty comfortable with how the company is spending its cash, as it seems on track to meet its needs over the medium term. While it's important to consider hard data like the metrics discussed above, many investors would also be interested to note that Opthea insiders have been trading shares in the company. Click here to find out if they have been buying or selling.
If you would prefer to check out another company with better fundamentals, then do not miss this free list of interesting companies, that have HIGH return on equity and low debt or this list of stocks which are all forecast to grow.
We aim to bring you long-term focused research analysis driven by fundamental data. Note that our analysis may not factor in the latest price-sensitive company announcements or qualitative material.
If you spot an error that warrants correction, please contact the editor at editorial-team@simplywallst.com. This article by Simply Wall St is general in nature. It does not constitute a recommendation to buy or sell any stock, and does not take account of your objectives, or your financial situation. Simply Wall St has no position in the stocks mentioned. Thank you for reading.

