We're Interested To See How Coursera (NYSE:COUR) Uses Its Cash Hoard To Grow
There's no doubt that money can be made by owning shares of unprofitable businesses. For example, biotech and mining exploration companies often lose money for years before finding success with a new treatment or mineral discovery. But while the successes are well known, investors should not ignore the very many unprofitable companies that simply burn through all their cash and collapse.
Given this risk, we thought we'd take a look at whether Coursera (NYSE:COUR) shareholders should be worried about its cash burn. For the purpose of this article, we'll define cash burn as the amount of cash the company is spending each year to fund its growth (also called its negative free cash flow). The first step is to compare its cash burn with its cash reserves, to give us its 'cash runway'.
View our latest analysis for Coursera
How Long Is Coursera's Cash Runway?
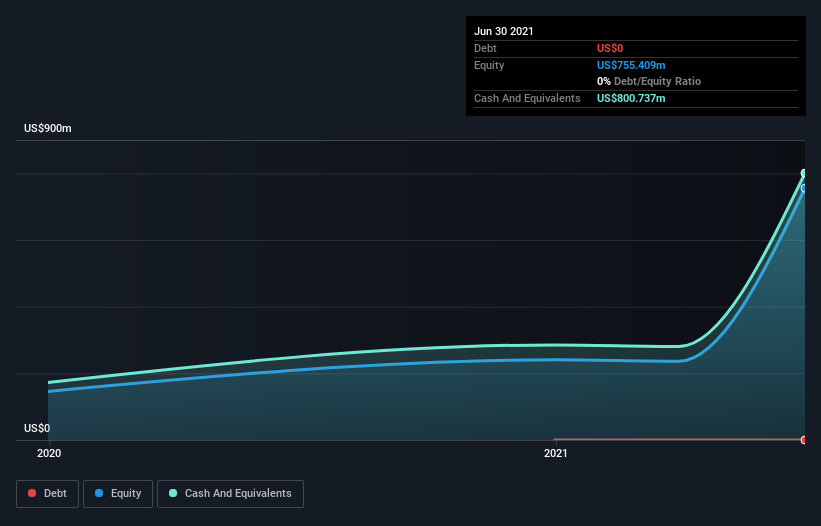
A company's cash runway is the amount of time it would take to burn through its cash reserves at its current cash burn rate. When Coursera last reported its balance sheet in June 2021, it had zero debt and cash worth US$801m. In the last year, its cash burn was US$43m. That means it had a cash runway of very many years as of June 2021. While this is only one measure of its cash burn situation, it certainly gives us the impression that holders have nothing to worry about. You can see how its cash balance has changed over time in the image below.
How Well Is Coursera Growing?
At first glance it's a bit worrying to see that Coursera actually boosted its cash burn by 48%, year on year. But looking on the bright side, its revenue gained by 93%, lending some credence to the growth narrative. Of course, with spend going up shareholders will want to see fast growth continue. Considering the factors above, the company doesn’t fare badly when it comes to assessing how it is changing over time. Clearly, however, the crucial factor is whether the company will grow its business going forward. For that reason, it makes a lot of sense to take a look at our analyst forecasts for the company.
How Hard Would It Be For Coursera To Raise More Cash For Growth?
There's no doubt Coursera seems to be in a fairly good position, when it comes to managing its cash burn, but even if it's only hypothetical, it's always worth asking how easily it could raise more money to fund growth. Companies can raise capital through either debt or equity. One of the main advantages held by publicly listed companies is that they can sell shares to investors to raise cash and fund growth. By comparing a company's annual cash burn to its total market capitalisation, we can estimate roughly how many shares it would have to issue in order to run the company for another year (at the same burn rate).
Since it has a market capitalisation of US$4.5b, Coursera's US$43m in cash burn equates to about 1.0% of its market value. That means it could easily issue a few shares to fund more growth, and might well be in a position to borrow cheaply.
How Risky Is Coursera's Cash Burn Situation?
It may already be apparent to you that we're relatively comfortable with the way Coursera is burning through its cash. In particular, we think its revenue growth stands out as evidence that the company is well on top of its spending. Although its increasing cash burn does give us reason for pause, the other metrics we discussed in this article form a positive picture overall. Looking at all the measures in this article, together, we're not worried about its rate of cash burn; the company seems well on top of its medium-term spending needs. Separately, we looked at different risks affecting the company and spotted 3 warning signs for Coursera (of which 1 doesn't sit too well with us!) you should know about.
Of course, you might find a fantastic investment by looking elsewhere. So take a peek at this free list of companies insiders are buying, and this list of stocks growth stocks (according to analyst forecasts)
This article by Simply Wall St is general in nature. We provide commentary based on historical data and analyst forecasts only using an unbiased methodology and our articles are not intended to be financial advice. It does not constitute a recommendation to buy or sell any stock, and does not take account of your objectives, or your financial situation. We aim to bring you long-term focused analysis driven by fundamental data. Note that our analysis may not factor in the latest price-sensitive company announcements or qualitative material. Simply Wall St has no position in any stocks mentioned.
Have feedback on this article? Concerned about the content? Get in touch with us directly. Alternatively, email editorial-team (at) simplywallst.com.

