We're A Little Worried About TC TECH Sweden's (STO:TCT) Cash Burn Rate

We can readily understand why investors are attracted to unprofitable companies. For example, although Amazon.com made losses for many years after listing, if you had bought and held the shares since 1999, you would have made a fortune. But the harsh reality is that very many loss making companies burn through all their cash and go bankrupt.
So should TC TECH Sweden (STO:TCT) shareholders be worried about its cash burn? For the purposes of this article, cash burn is the annual rate at which an unprofitable company spends cash to fund its growth; its negative free cash flow. First, we'll determine its cash runway by comparing its cash burn with its cash reserves.
Check out our latest analysis for TC TECH Sweden
Does TC TECH Sweden Have A Long Cash Runway?
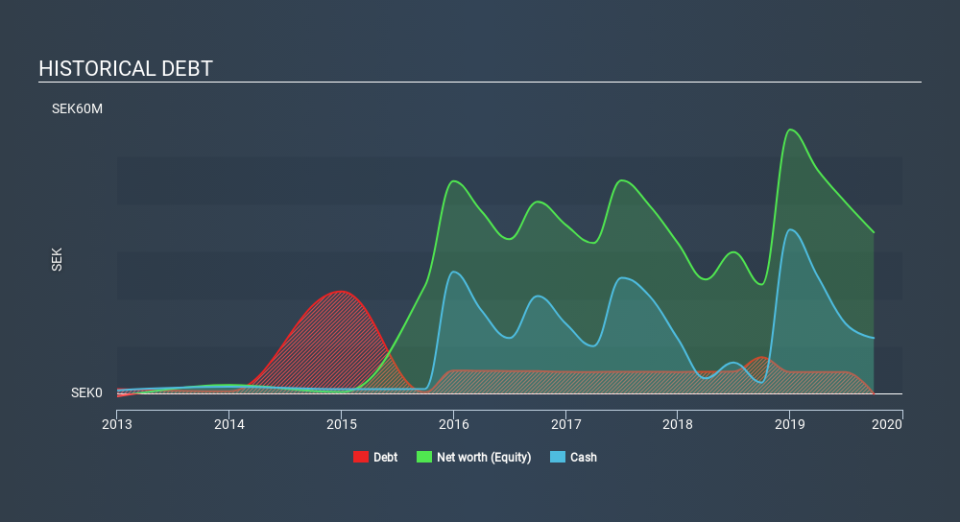
A cash runway is defined as the length of time it would take a company to run out of money if it kept spending at its current rate of cash burn. In September 2019, TC TECH Sweden had kr12m in cash, and was debt-free. Looking at the last year, the company burnt through kr34m. That means it had a cash runway of around 4 months as of September 2019. With a cash runway that short, we strongly believe that the company must raise cash or else douse its cash burn promptly. Depicted below, you can see how its cash holdings have changed over time.
How Is TC TECH Sweden's Cash Burn Changing Over Time?
In the last year, TC TECH Sweden did book revenue of kr13m, but its revenue from operations was less, at just kr13m. We don't think that's enough operating revenue for us to understand too much from revenue growth rates, since the company is growing off a low base. So we'll focus on the cash burn, today. With the cash burn rate up 2.4% in the last year, it seems that the company is ratcheting up investment in the business over time. That's not necessarily a bad thing, but investors should be mindful of the fact that will shorten the cash runway. Of course, we've only taken a quick look at the stock's growth metrics, here. You can take a look at how TC TECH Sweden is growing revenue over time by checking this visualization of past revenue growth.
How Easily Can TC TECH Sweden Raise Cash?
Since its cash burn is increasing (albeit only slightly), TC TECH Sweden shareholders should still be mindful of the possibility it will require more cash in the future. Issuing new shares, or taking on debt, are the most common ways for a listed company to raise more money for its business. One of the main advantages held by publicly listed companies is that they can sell shares to investors to raise cash to fund growth. We can compare a company's cash burn to its market capitalisation to get a sense for how many new shares a company would have to issue to fund one year's operations.
TC TECH Sweden has a market capitalisation of kr200m and burnt through kr34m last year, which is 17% of the company's market value. As a result, we'd venture that the company could raise more cash for growth without much trouble, albeit at the cost of some dilution.
So, Should We Worry About TC TECH Sweden's Cash Burn?
On this analysis of TC TECH Sweden's cash burn, we think its cash burn relative to its market cap was reassuring, while its cash runway has us a bit worried. After looking at that range of measures, we think shareholders should be extremely attentive to how the company is using its cash, as the cash burn makes us uncomfortable. While it's important to consider hard data like the metrics discussed above, many investors would also be interested to note that TC TECH Sweden insiders have been trading shares in the company. Click here to find out if they have been buying or selling.
Of course, you might find a fantastic investment by looking elsewhere. So take a peek at this free list of interesting companies, and this list of stocks growth stocks (according to analyst forecasts)
If you spot an error that warrants correction, please contact the editor at editorial-team@simplywallst.com. This article by Simply Wall St is general in nature. It does not constitute a recommendation to buy or sell any stock, and does not take account of your objectives, or your financial situation. Simply Wall St has no position in the stocks mentioned.
We aim to bring you long-term focused research analysis driven by fundamental data. Note that our analysis may not factor in the latest price-sensitive company announcements or qualitative material. Thank you for reading.
