Should Wereldhave Belgium (EBR:WEHB) Focus On Improving This Fundamental Metric?

Many investors are still learning about the various metrics that can be useful when analysing a stock. This article is for those who would like to learn about Return On Equity (ROE). We'll use ROE to examine Wereldhave Belgium (EBR:WEHB), by way of a worked example.
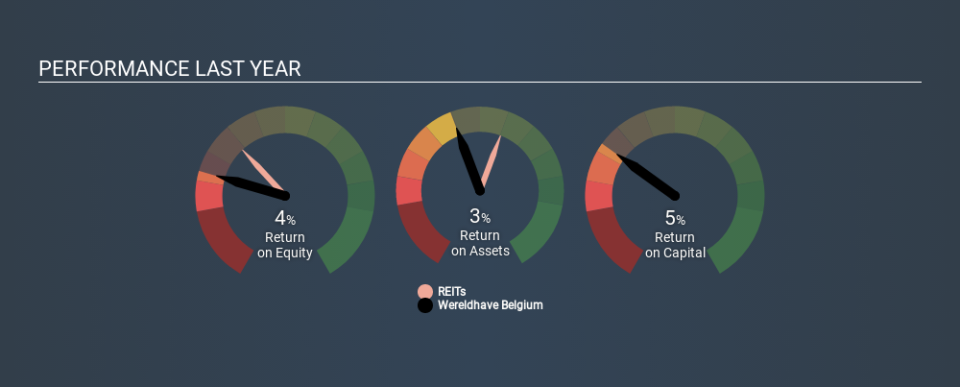
Our data shows Wereldhave Belgium has a return on equity of 4.2% for the last year. That means that for every €1 worth of shareholders' equity, it generated €0.04 in profit.
View our latest analysis for Wereldhave Belgium
How Do You Calculate ROE?
The formula for return on equity is:
Return on Equity = Net Profit (from continuing operations) ÷ Shareholders' Equity
Or for Wereldhave Belgium:
4.2% = €29m ÷ €689m (Based on the trailing twelve months to December 2019.)
Most readers would understand what net profit is, but it’s worth explaining the concept of shareholders’ equity. It is all the money paid into the company from shareholders, plus any earnings retained. You can calculate shareholders' equity by subtracting the company's total liabilities from its total assets.
What Does Return On Equity Signify?
Return on Equity measures a company's profitability against the profit it has kept for the business (plus any capital injections). The 'return' is the amount earned after tax over the last twelve months. The higher the ROE, the more profit the company is making. So, all else being equal, a high ROE is better than a low one. Clearly, then, one can use ROE to compare different companies.
Does Wereldhave Belgium Have A Good Return On Equity?
Arguably the easiest way to assess company's ROE is to compare it with the average in its industry. The limitation of this approach is that some companies are quite different from others, even within the same industry classification. If you look at the image below, you can see Wereldhave Belgium has a lower ROE than the average (11%) in the REITs industry classification.
That's not what we like to see. We prefer it when the ROE of a company is above the industry average, but it's not the be-all and end-all if it is lower. Nonetheless, it might be wise to check if insiders have been selling.
The Importance Of Debt To Return On Equity
Companies usually need to invest money to grow their profits. That cash can come from issuing shares, retained earnings, or debt. In the case of the first and second options, the ROE will reflect this use of cash, for growth. In the latter case, the use of debt will improve the returns, but will not change the equity. That will make the ROE look better than if no debt was used.
Wereldhave Belgium's Debt And Its 4.2% ROE
Wereldhave Belgium has a debt to equity ratio of 0.40, which is far from excessive. Although the ROE isn't overly impressive, the debt load is modest, suggesting the business has potential. Judicious use of debt to improve returns can certainly be a good thing, although it does elevate risk slightly and reduce future optionality.
But It's Just One Metric
Return on equity is a useful indicator of the ability of a business to generate profits and return them to shareholders. Companies that can achieve high returns on equity without too much debt are generally of good quality. All else being equal, a higher ROE is better.
Having said that, while ROE is a useful indicator of business quality, you'll have to look at a whole range of factors to determine the right price to buy a stock. Profit growth rates, versus the expectations reflected in the price of the stock, are a particularly important to consider. So I think it may be worth checking this free this detailed graph of past earnings, revenue and cash flow.
Of course Wereldhave Belgium may not be the best stock to buy. So you may wish to see this free collection of other companies that have high ROE and low debt.
If you spot an error that warrants correction, please contact the editor at editorial-team@simplywallst.com. This article by Simply Wall St is general in nature. It does not constitute a recommendation to buy or sell any stock, and does not take account of your objectives, or your financial situation. Simply Wall St has no position in the stocks mentioned.
We aim to bring you long-term focused research analysis driven by fundamental data. Note that our analysis may not factor in the latest price-sensitive company announcements or qualitative material. Thank you for reading.

