The West outpaces the South in physical activity, CDC says. How does your state rank?
The South had more physically inactive adults than any other U.S. region, according to a new study.
The Centers for Disease Prevention and Control survey also showed significant differences between black and Hispanic adults and whites.
The CDC released data from 2015-2018 on physical inactivity in the country based on ongoing telephone interviews of adults.
The survey asked respondents this question: During the past month, other than your regular job, did you participate in any physical activities or exercises such as running, calisthenics, golf, gardening, or walking for exercise?
A person was considered physically inactive if they answered “no.”
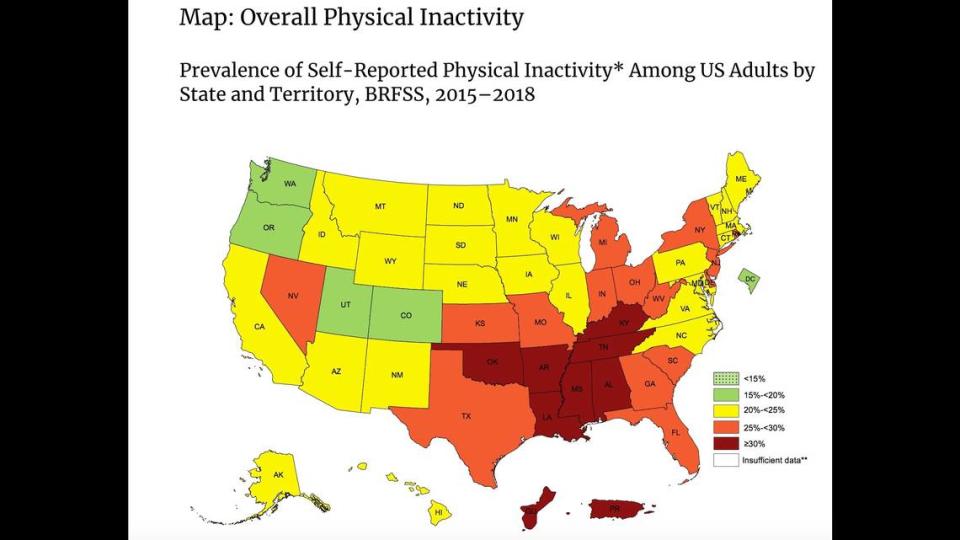
Each state had at least 15 percent of adults considered to be physically inactive.
But some states had far fewer than others. Colorado, Washington, Utah, Oregon and Washington, D.C., had between 15 percent and less than 20 percent.
Meanwhile, Tennessee, Oklahoma, Louisiana, Alabama, Kentucky, Arkansas and Mississippi all had at least 30 percent of adults considered to be physically inactive.
Broken down by U.S. region, the South had the highest prevalence of physical inactivity at 28 percent, then the Northeast at 25.6 percent, the Midwest at 25 percent and the West at 20.5 percent.
Results based on race and ethnicity varied, too. Hispanics had the highest prevalence of physical inactivity at 31.7 percent, followed by blacks at 30.3 percent and whites at 23.4 percent.
Here’s the ranking of every state and Puerto Rico and Guam with the percentage of adults considered to be physically inactive.
1. | Puerto Rico | 47.7 |
2. | Mississippi | 33 |
3. | Arkansas | 32.5 |
4. | Kentucky | 32.2 |
5. | Alabama | 31 |
6. | Guam | 31 |
7. | Louisiana | 30.9 |
8. | Oklahoma | 30.2 |
9. | Tennessee | 30 |
10. | West Virginia | 29.8 |
11. | New Jersey | 28.7 |
12. | Georgia | 28.5 |
13. | Delaware | 28.4 |
14. | Indiana | 28.3 |
15. | Florida | 28 |
16. | Texas | 27.9 |
17. | South Carolina | 27.2 |
18. | Ohio | 27 |
19. | Missouri | 26.8 |
20. | New York | 26.6 |
21. | Rhode Island | 25.9 |
22. | Nevada | 25.6 |
23. | Michigan | 25.1 |
24. | Kansas | 25 |
25. | Pennsylvania | 24.8 |
26. | North Carolina | 24.7 |
27. | North Dakota | 24.6 |
28. | Illinois | 24.3 |
29. | Iowa | 24.2 |
30. | Nebraska | 24.2 |
31. | Wyoming | 24.1 |
32. | Virginia | 24 |
33. | Maryland | 23.9 |
34. | Arizona | 23.7 |
35. | Massachusetts | 23.3 |
36. | Maine | 23.2 |
37. | Connecticut | 22.7 |
38. | Montana | 22.5 |
39. | New Mexico | 22.3 |
40. | South Dakota | 22.3 |
41. | New Hampshire | 21.8 |
42. | Hawaii | 21.6 |
43. | Idaho | 21.5 |
44. | Wisconsin | 21.4 |
45. | Minnesota | 21.2 |
46. | Vermont | 20.5 |
47. | California | 20.4 |
48. | Alaska | 20.3 |
49. | District of Columbia | 19.8 |
50. | Oregon | 19.2 |
51. | Utah | 18.6 |
52. | Washington | 18.3 |
53. | Colorado | 17.3 |
Cancers once linked to tobacco use now more closely connected to HPV, Texas study says

