Where is Hurricane Tammy heading? This controversial graphic has answers.
The peak of the busy 2023 Atlantic hurricane season may be over, but the tropics are still active.
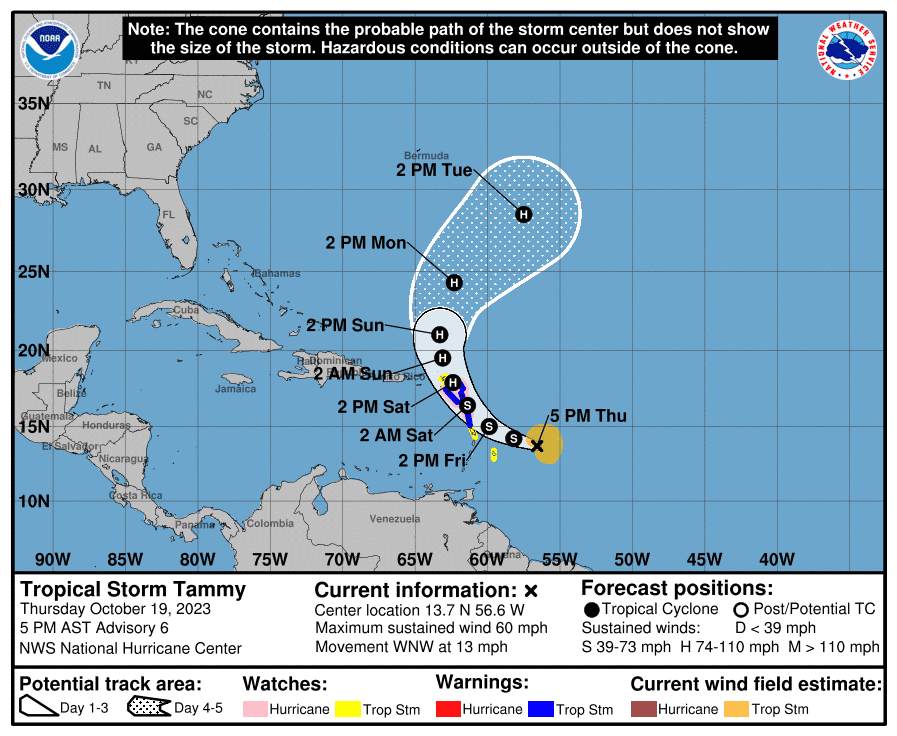
Tammy strengthened into a hurricane Thursday morning, even after 18 named storms and a January storm that the National Hurricane Center concluded afterward should have been named.
The storm is forecast to move near or over the Leeward Islands east of Puerto Rico on Saturday and Sunday, then turn northeastward into the Atlantic. The center warns the Virgin Islands and Puerto Rico could see up to four inches of rain.
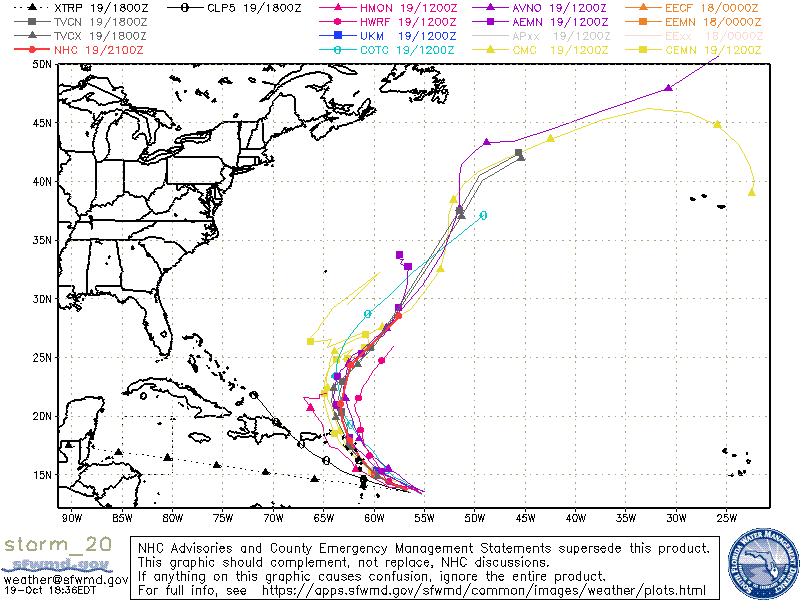
Tammy's formation also spawned the potential forecast track maps commonly called spaghetti models and spaghetti plots.
"Spaghetti models" has become the catch-all term for maps that illustrate the tools that guide forecasters. The term spaghetti refers to the way computers represent data visually because the lines often wind up looking like the pasta.
In the case of tropical cyclone forecasts, the lines on "spaghetti models" show potential paths that individual models or groups of models suggest a storm could take. Widely distributed, the maps are interpreted by everyone from professional meteorologists with experience and context to high school students with social media accounts.
Misinterpretation by people who do not understand the skill or accuracy behind the lines can obscure important safety information for people within the path of a storm. That concerns meteorologists and public safety experts, who warn people need to pay closer attention to official forecasts, such as the hurricane center's forecast track, and less to the speculation that swirls around spaghetti maps.
What can an amateur glean from spaghetti models?
Someone who tries to interpret a "spaghetti map" without knowing the difference between models and which are more skillful than others “is probably not helping themselves,” said James Franklin, a retired branch chief for the center’s hurricane specialists.
However, even the most inexperienced viewer can draw the same broad conclusion from the model maps that hurricane specialists do.
In Tammy's case, the lines on the model maps are clustered pretty close together and pointing in the same general direction. When that happens, it's the best scenario because it adds confidence to the forecasts, Franklin said.
Sometimes the lines look more like spaghetti tossed onto a plate. When the lines representing the model plots are scattered in multiple directions, that's "a really uncertain situation," and a good time to pay close attention to the hurricane center’s forecast, Franklin said.
That’s when it becomes important to understand what the maps do — and don’t — reveal about the potential path of a tropical cyclone.
What are spaghetti model maps?
"At their heart, models are computer coding that performs a bunch of math equations that say what the atmosphere is going to do," said Andy Hazelton, an associate scientist with the University of Miami and the National Oceanic and Atmospheric Administration's Cooperative Institute for Marine and Atmospheric Studies.
The so-called spaghetti model maps show the answers to those math equations at a given point in time. The lines show what the models predict after the computers solve equations with the existing and potential conditions in the atmosphere and ocean, including winds, air pressure, air and ocean temperatures, and humidity.
Models are like the small square pixels of color you see when you zoom in closely on a digital photo, said David Nolan, a professor of atmospheric science at the University of Miami’s Rosenstiel School. Essentially, they cover the Earth with millions and millions of little squares, requiring "very big computers going very, very fast."
A model will do "mathematical calculations to say, 'Alright, given what’s happening in this pixel today, what’s going to happen in that pixel in the next 10 minutes?' and it does that for all the little pixels all over the entire world," Nolan said. "The models predict how the temperature and the pressure and the wind is going to evolve in all the little square grids."
How does the hurricane center use models?
The best forecast is not a single model, said Jeff Masters, a meteorologist with Yale Climate Connections and a former hurricane hunter. "It’s a consensus forecast where you bring a bunch of models in and average them together.”
Consensus models reduce errors, said Masters and Franklin.
The hurricane center's consensus models are the best available, said Clark Evans, professor and chair of atmospheric sciences at the University of Wisconsin-Milwaukee.
Before each new tropical cyclone forecast, hurricane center specialists analyze the latest results from the consensus models the center builds by combining various individual models and model ensembles. The center's consensus models are put together based on model performance over the previous hurricane season.
Some of the bigger global models take so long to run that the information they provide must be adjusted forward based on a storm’s current position when the center makes its forecast update every six hours.
The center's specialists also review the latest aircraft reconnaissance information about the storm's location and conditions, Franklin said. Then the specialists plot the official forecast track – the likely future path and intensity of the storm.
“Any one specific model is very rarely going to beat the hurricane center forecast for a particular storm, and almost never for an entire season," Masters said.
It's important to know what's in the spaghetti
With each spaghetti map, it’s important to know what’s behind the lines representing the forecast tools and models.
A map published by the South Florida Water Management District, for example, includes the caveat that it’s "intended for use by individuals with proper training and expertise."
Sometimes the biases of the different models cancel each other out, but the biases also can change from one storm to the next, Evans said.
Some models are better at forecasting weak systems, while others are better at handling well-organized intense systems. Some lines are just one member in a global ensemble model, produced by tweaking certain conditions in the equations.
A few lines on the maps aren’t especially relevant or valuable. For example, a single straight black line seen on many model maps, labeled XTRP, isn’t a model at all, Masters said. It extrapolates from a storm's previous positions. Another – labeled CLP5 – depicts what historical storms have done in that situation.
At least one key model used by the hurricane center – the Florida State University Super Ensemble – isn’t available in the public maps, Masters said.
If you’re unsure, "always default" to the hurricane center, Hazelton said. "Trust them for making decisions."
Up-to-the-minute information has been key to improving forecasts
The forecast models use data gathered from multiple sources, including satellite weather observations. Model runs start with the current state of the atmosphere and go forward, Franklin said.
"A lot of the forecast improvements we've seen have to do with getting the starting point right," he said. "You might have an error somewhere if it’s too warm or something wasn’t analyzed right."
Such errors grow with time and are "a big part of why you can only run models out so far," Franklin said. On the flip side, the models are also part of the reason forecasts can be 5 to 7 days out now instead of the 2 to 3 days they were 20 years ago.
Computer models have improved "tremendously over the last 20 to 30 years," Nolan said.
Improvement has come by giving computers more of two things:
Power: "So the pixels can be smaller, to give you a sharper picture of the weather," Nolan said.
Information: "Mostly through satellites and observations around the globe," Franklin said.
NOAA added a new model to the mix this year, the Hurricane Analysis and Forecast System, for determining track, intensity, size, and structure, including changes in rapid intensification.
Hazelton, among the collaborators who developed the model, said so far this season "it has been performing well."
Where can you get more information?
This article originally appeared on USA TODAY: Hurricane Tammy forecast: Spaghetti models explained

