Why Acuity Brands, Inc.’s (NYSE:AYI) Return On Capital Employed Is Impressive

Today we are going to look at Acuity Brands, Inc. (NYSE:AYI) to see whether it might be an attractive investment prospect. Specifically, we'll consider its Return On Capital Employed (ROCE), since that will give us an insight into how efficiently the business can generate profits from the capital it requires.
First of all, we'll work out how to calculate ROCE. Next, we'll compare it to others in its industry. Last but not least, we'll look at what impact its current liabilities have on its ROCE.
What is Return On Capital Employed (ROCE)?
ROCE is a metric for evaluating how much pre-tax income (in percentage terms) a company earns on the capital invested in its business. Generally speaking a higher ROCE is better. Ultimately, it is a useful but imperfect metric. Author Edwin Whiting says to be careful when comparing the ROCE of different businesses, since 'No two businesses are exactly alike.
So, How Do We Calculate ROCE?
The formula for calculating the return on capital employed is:
Return on Capital Employed = Earnings Before Interest and Tax (EBIT) ÷ (Total Assets - Current Liabilities)
Or for Acuity Brands:
0.16 = US$438m ÷ (US$3.3b - US$573m) (Based on the trailing twelve months to November 2019.)
Therefore, Acuity Brands has an ROCE of 16%.
View our latest analysis for Acuity Brands
Does Acuity Brands Have A Good ROCE?
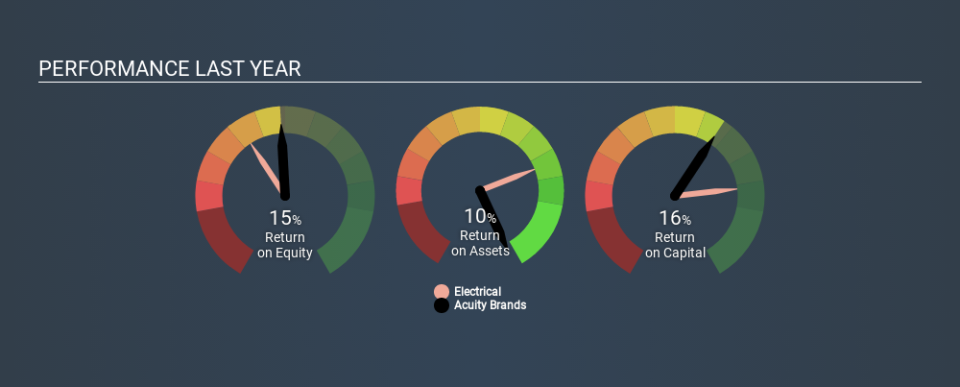
One way to assess ROCE is to compare similar companies. Acuity Brands's ROCE appears to be substantially greater than the 9.9% average in the Electrical industry. We would consider this a positive, as it suggests it is using capital more effectively than other similar companies. Regardless of where Acuity Brands sits next to its industry, its ROCE in absolute terms appears satisfactory, and this company could be worth a closer look.
We can see that, Acuity Brands currently has an ROCE of 16%, less than the 22% it reported 3 years ago. So investors might consider if it has had issues recently. The image below shows how Acuity Brands's ROCE compares to its industry, and you can click it to see more detail on its past growth.
It is important to remember that ROCE shows past performance, and is not necessarily predictive. Companies in cyclical industries can be difficult to understand using ROCE, as returns typically look high during boom times, and low during busts. ROCE is, after all, simply a snap shot of a single year. What happens in the future is pretty important for investors, so we have prepared a free report on analyst forecasts for Acuity Brands.
Acuity Brands's Current Liabilities And Their Impact On Its ROCE
Liabilities, such as supplier bills and bank overdrafts, are referred to as current liabilities if they need to be paid within 12 months. The ROCE equation subtracts current liabilities from capital employed, so a company with a lot of current liabilities appears to have less capital employed, and a higher ROCE than otherwise. To counter this, investors can check if a company has high current liabilities relative to total assets.
Acuity Brands has total assets of US$3.3b and current liabilities of US$573m. As a result, its current liabilities are equal to approximately 17% of its total assets. Current liabilities are minimal, limiting the impact on ROCE.
What We Can Learn From Acuity Brands's ROCE
This is good to see, and with a sound ROCE, Acuity Brands could be worth a closer look. There might be better investments than Acuity Brands out there, but you will have to work hard to find them . These promising businesses with rapidly growing earnings might be right up your alley.
For those who like to find winning investments this free list of growing companies with recent insider purchasing, could be just the ticket.
If you spot an error that warrants correction, please contact the editor at editorial-team@simplywallst.com. This article by Simply Wall St is general in nature. It does not constitute a recommendation to buy or sell any stock, and does not take account of your objectives, or your financial situation. Simply Wall St has no position in the stocks mentioned.
We aim to bring you long-term focused research analysis driven by fundamental data. Note that our analysis may not factor in the latest price-sensitive company announcements or qualitative material. Thank you for reading.
