Here’s why ad pepper media International N.V.’s (ETR:APM) Returns On Capital Matters So Much

Want to participate in a short research study? Help shape the future of investing tools and you could win a $250 gift card!
Today we are going to look at ad pepper media International N.V. (ETR:APM) to see whether it might be an attractive investment prospect. Specifically, we're going to calculate its Return On Capital Employed (ROCE), in the hopes of getting some insight into the business.
Firstly, we'll go over how we calculate ROCE. Then we'll compare its ROCE to similar companies. And finally, we'll look at how its current liabilities are impacting its ROCE.
Understanding Return On Capital Employed (ROCE)
ROCE is a measure of a company's yearly pre-tax profit (its return), relative to the capital employed in the business. All else being equal, a better business will have a higher ROCE. Overall, it is a valuable metric that has its flaws. Author Edwin Whiting says to be careful when comparing the ROCE of different businesses, since 'No two businesses are exactly alike.'
So, How Do We Calculate ROCE?
Analysts use this formula to calculate return on capital employed:
Return on Capital Employed = Earnings Before Interest and Tax (EBIT) ÷ (Total Assets - Current Liabilities)
Or for ad pepper media International:
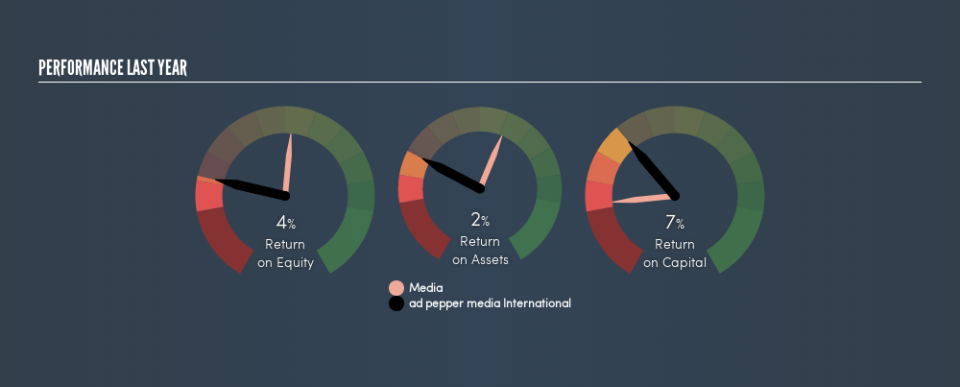
0.072 = €1.4m ÷ (€40m - €21m) (Based on the trailing twelve months to March 2019.)
So, ad pepper media International has an ROCE of 7.2%.
Check out our latest analysis for ad pepper media International
Is ad pepper media International's ROCE Good?
ROCE is commonly used for comparing the performance of similar businesses. We can see ad pepper media International's ROCE is meaningfully below the Media industry average of 10%. This performance is not ideal, as it suggests the company may not be deploying its capital as effectively as some competitors. Aside from the industry comparison, ad pepper media International's ROCE is mediocre in absolute terms, considering the risk of investing in stocks versus the safety of a bank account. Readers may find more attractive investment prospects elsewhere.
In our analysis, ad pepper media International's ROCE appears to be 7.2%, compared to 3 years ago, when its ROCE was 0.5%. This makes us think the business might be improving.
When considering this metric, keep in mind that it is backwards looking, and not necessarily predictive. ROCE can be deceptive for cyclical businesses, as returns can look incredible in boom times, and terribly low in downturns. ROCE is only a point-in-time measure. Since the future is so important for investors, you should check out our free report on analyst forecasts for ad pepper media International.
ad pepper media International's Current Liabilities And Their Impact On Its ROCE
Short term (or current) liabilities, are things like supplier invoices, overdrafts, or tax bills that need to be paid within 12 months. Due to the way the ROCE equation works, having large bills due in the near term can make it look as though a company has less capital employed, and thus a higher ROCE than usual. To check the impact of this, we calculate if a company has high current liabilities relative to its total assets.
ad pepper media International has total liabilities of €21m and total assets of €40m. As a result, its current liabilities are equal to approximately 51% of its total assets. ad pepper media International's current liabilities are fairly high, making its ROCE look better than otherwise.
The Bottom Line On ad pepper media International's ROCE
Notably, it also has a mediocre ROCE, which to my mind is not an appealing combination. You might be able to find a better investment than ad pepper media International. If you want a selection of possible winners, check out this free list of interesting companies that trade on a P/E below 20 (but have proven they can grow earnings).
If you are like me, then you will not want to miss this free list of growing companies that insiders are buying.
We aim to bring you long-term focused research analysis driven by fundamental data. Note that our analysis may not factor in the latest price-sensitive company announcements or qualitative material.
If you spot an error that warrants correction, please contact the editor at editorial-team@simplywallst.com. This article by Simply Wall St is general in nature. It does not constitute a recommendation to buy or sell any stock, and does not take account of your objectives, or your financial situation. Simply Wall St has no position in the stocks mentioned. Thank you for reading.

