Why You Should Like Amadeus IT Group, S.A.’s (BME:AMS) ROCE

Today we'll look at Amadeus IT Group, S.A. (BME:AMS) and reflect on its potential as an investment. Specifically, we'll consider its Return On Capital Employed (ROCE), since that will give us an insight into how efficiently the business can generate profits from the capital it requires.
Firstly, we'll go over how we calculate ROCE. Then we'll compare its ROCE to similar companies. And finally, we'll look at how its current liabilities are impacting its ROCE.
What is Return On Capital Employed (ROCE)?
ROCE is a metric for evaluating how much pre-tax income (in percentage terms) a company earns on the capital invested in its business. Generally speaking a higher ROCE is better. Overall, it is a valuable metric that has its flaws. Renowned investment researcher Michael Mauboussin has suggested that a high ROCE can indicate that 'one dollar invested in the company generates value of more than one dollar'.
So, How Do We Calculate ROCE?
Analysts use this formula to calculate return on capital employed:
Return on Capital Employed = Earnings Before Interest and Tax (EBIT) ÷ (Total Assets - Current Liabilities)
Or for Amadeus IT Group:
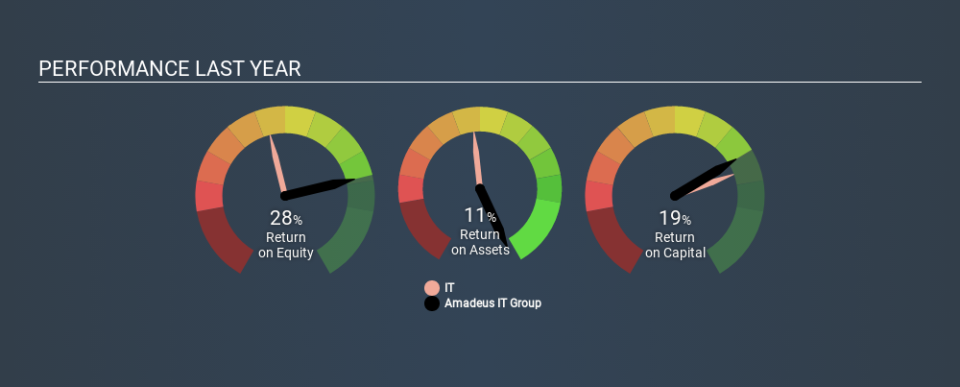
0.19 = €1.5b ÷ (€10b - €2.5b) (Based on the trailing twelve months to September 2019.)
Therefore, Amadeus IT Group has an ROCE of 19%.
View our latest analysis for Amadeus IT Group
Does Amadeus IT Group Have A Good ROCE?
ROCE can be useful when making comparisons, such as between similar companies. Using our data, we find that Amadeus IT Group's ROCE is meaningfully better than the 9.3% average in the IT industry. I think that's good to see, since it implies the company is better than other companies at making the most of its capital. Putting aside its position relative to its industry for now, in absolute terms, Amadeus IT Group's ROCE is currently very good.
You can see in the image below how Amadeus IT Group's ROCE compares to its industry. Click to see more on past growth.
Remember that this metric is backwards looking - it shows what has happened in the past, and does not accurately predict the future. ROCE can be misleading for companies in cyclical industries, with returns looking impressive during the boom times, but very weak during the busts. ROCE is, after all, simply a snap shot of a single year. Since the future is so important for investors, you should check out our free report on analyst forecasts for Amadeus IT Group.
How Amadeus IT Group's Current Liabilities Impact Its ROCE
Current liabilities include invoices, such as supplier payments, short-term debt, or a tax bill, that need to be paid within 12 months. Due to the way ROCE is calculated, a high level of current liabilities makes a company look as though it has less capital employed, and thus can (sometimes unfairly) boost the ROCE. To counter this, investors can check if a company has high current liabilities relative to total assets.
Amadeus IT Group has total liabilities of €2.5b and total assets of €10b. Therefore its current liabilities are equivalent to approximately 23% of its total assets. The fairly low level of current liabilities won't have much impact on the already great ROCE.
Our Take On Amadeus IT Group's ROCE
, There might be better investments than Amadeus IT Group out there, but you will have to work hard to find them . These promising businesses with rapidly growing earnings might be right up your alley.
For those who like to find winning investments this free list of growing companies with recent insider purchasing, could be just the ticket.
If you spot an error that warrants correction, please contact the editor at editorial-team@simplywallst.com. This article by Simply Wall St is general in nature. It does not constitute a recommendation to buy or sell any stock, and does not take account of your objectives, or your financial situation. Simply Wall St has no position in the stocks mentioned.
We aim to bring you long-term focused research analysis driven by fundamental data. Note that our analysis may not factor in the latest price-sensitive company announcements or qualitative material. Thank you for reading.
