Why ams AG’s (VTX:AMS) Return On Capital Employed Might Be A Concern

Today we are going to look at ams AG (VTX:AMS) to see whether it might be an attractive investment prospect. To be precise, we'll consider its Return On Capital Employed (ROCE), as that will inform our view of the quality of the business.
First, we'll go over how we calculate ROCE. Second, we'll look at its ROCE compared to similar companies. Finally, we'll look at how its current liabilities affect its ROCE.
Understanding Return On Capital Employed (ROCE)
ROCE measures the 'return' (pre-tax profit) a company generates from capital employed in its business. Generally speaking a higher ROCE is better. In brief, it is a useful tool, but it is not without drawbacks. Author Edwin Whiting says to be careful when comparing the ROCE of different businesses, since 'No two businesses are exactly alike.
So, How Do We Calculate ROCE?
The formula for calculating the return on capital employed is:
Return on Capital Employed = Earnings Before Interest and Tax (EBIT) ÷ (Total Assets - Current Liabilities)
Or for ams:
0.018 = €52m ÷ (€3.5b - €561m) (Based on the trailing twelve months to June 2019.)
So, ams has an ROCE of 1.8%.
View our latest analysis for ams
Does ams Have A Good ROCE?
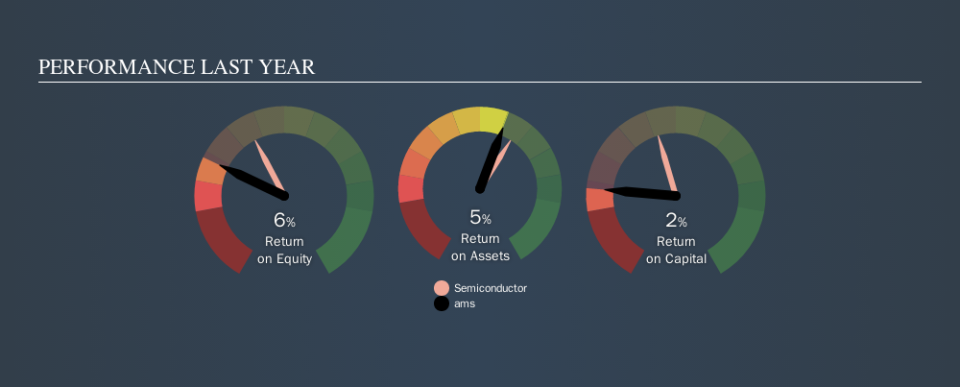
ROCE is commonly used for comparing the performance of similar businesses. Using our data, ams's ROCE appears to be significantly below the 9.6% average in the Semiconductor industry. This performance could be negative if sustained, as it suggests the business may underperform its industry. Putting aside ams's performance relative to its industry, its ROCE in absolute terms is poor - considering the risk of owning stocks compared to government bonds. Readers may wish to look for more rewarding investments.
We can see that, ams currently has an ROCE of 1.8%, less than the 10% it reported 3 years ago. So investors might consider if it has had issues recently. You can click on the image below to see (in greater detail) how ams's past growth compares to other companies.
When considering this metric, keep in mind that it is backwards looking, and not necessarily predictive. ROCE can be misleading for companies in cyclical industries, with returns looking impressive during the boom times, but very weak during the busts. ROCE is, after all, simply a snap shot of a single year. What happens in the future is pretty important for investors, so we have prepared a free report on analyst forecasts for ams.
What Are Current Liabilities, And How Do They Affect ams's ROCE?
Current liabilities include invoices, such as supplier payments, short-term debt, or a tax bill, that need to be paid within 12 months. Due to the way the ROCE equation works, having large bills due in the near term can make it look as though a company has less capital employed, and thus a higher ROCE than usual. To check the impact of this, we calculate if a company has high current liabilities relative to its total assets.
ams has total assets of €3.5b and current liabilities of €561m. As a result, its current liabilities are equal to approximately 16% of its total assets. This is a modest level of current liabilities, which will have a limited impact on the ROCE.
Our Take On ams's ROCE
That's not a bad thing, however ams has a weak ROCE and may not be an attractive investment. You might be able to find a better investment than ams. If you want a selection of possible winners, check out this free list of interesting companies that trade on a P/E below 20 (but have proven they can grow earnings).
If you are like me, then you will not want to miss this free list of growing companies that insiders are buying.
We aim to bring you long-term focused research analysis driven by fundamental data. Note that our analysis may not factor in the latest price-sensitive company announcements or qualitative material.
If you spot an error that warrants correction, please contact the editor at editorial-team@simplywallst.com. This article by Simply Wall St is general in nature. It does not constitute a recommendation to buy or sell any stock, and does not take account of your objectives, or your financial situation. Simply Wall St has no position in the stocks mentioned. Thank you for reading.

