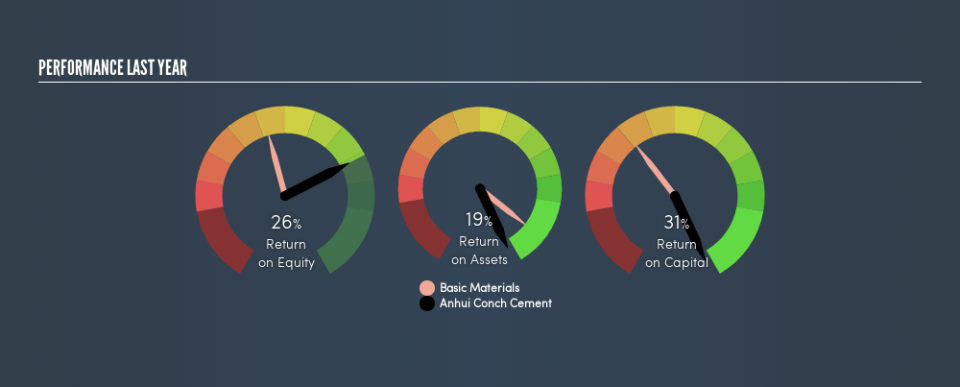
Why We Like Anhui Conch Cement Company Limited’s (HKG:914) 31% Return On Capital Employed

Today we'll look at Anhui Conch Cement Company Limited (HKG:914) and reflect on its potential as an investment. In particular, we'll consider its Return On Capital Employed (ROCE), as that can give us insight into how profitably the company is able to employ capital in its business.
First of all, we'll work out how to calculate ROCE. Then we'll compare its ROCE to similar companies. Then we'll determine how its current liabilities are affecting its ROCE.
Understanding Return On Capital Employed (ROCE)
ROCE is a measure of a company's yearly pre-tax profit (its return), relative to the capital employed in the business. All else being equal, a better business will have a higher ROCE. Overall, it is a valuable metric that has its flaws. Author Edwin Whiting says to be careful when comparing the ROCE of different businesses, since 'No two businesses are exactly alike.'
So, How Do We Calculate ROCE?
Analysts use this formula to calculate return on capital employed:
Return on Capital Employed = Earnings Before Interest and Tax (EBIT) ÷ (Total Assets - Current Liabilities)
Or for Anhui Conch Cement:
0.31 = CN¥40b ÷ (CN¥152b - CN¥22b) (Based on the trailing twelve months to March 2019.)
So, Anhui Conch Cement has an ROCE of 31%.
See our latest analysis for Anhui Conch Cement
Is Anhui Conch Cement's ROCE Good?
ROCE can be useful when making comparisons, such as between similar companies. Anhui Conch Cement's ROCE appears to be substantially greater than the 18% average in the Basic Materials industry. We consider this a positive sign, because it suggests it uses capital more efficiently than similar companies. Setting aside the comparison to its industry for a moment, Anhui Conch Cement's ROCE in absolute terms currently looks quite high.
We can see that , Anhui Conch Cement currently has an ROCE of 31% compared to its ROCE 3 years ago, which was 7.5%. This makes us think about whether the company has been reinvesting shrewdly. The image below shows how Anhui Conch Cement's ROCE compares to its industry, and you can click it to see more detail on its past growth.
Remember that this metric is backwards looking - it shows what has happened in the past, and does not accurately predict the future. ROCE can be deceptive for cyclical businesses, as returns can look incredible in boom times, and terribly low in downturns. This is because ROCE only looks at one year, instead of considering returns across a whole cycle. Since the future is so important for investors, you should check out our free report on analyst forecasts for Anhui Conch Cement.
Anhui Conch Cement's Current Liabilities And Their Impact On Its ROCE
Liabilities, such as supplier bills and bank overdrafts, are referred to as current liabilities if they need to be paid within 12 months. Due to the way the ROCE equation works, having large bills due in the near term can make it look as though a company has less capital employed, and thus a higher ROCE than usual. To counter this, investors can check if a company has high current liabilities relative to total assets.
Anhui Conch Cement has total liabilities of CN¥22b and total assets of CN¥152b. Therefore its current liabilities are equivalent to approximately 14% of its total assets. The fairly low level of current liabilities won't have much impact on the already great ROCE.
What We Can Learn From Anhui Conch Cement's ROCE
This is good to see, and with such a high ROCE, Anhui Conch Cement may be worth a closer look. Anhui Conch Cement shapes up well under this analysis, but it is far from the only business delivering excellent numbers . You might also want to check this free collection of companies delivering excellent earnings growth.
If you like to buy stocks alongside management, then you might just love this free list of companies. (Hint: insiders have been buying them).
We aim to bring you long-term focused research analysis driven by fundamental data. Note that our analysis may not factor in the latest price-sensitive company announcements or qualitative material.
If you spot an error that warrants correction, please contact the editor at editorial-team@simplywallst.com. This article by Simply Wall St is general in nature. It does not constitute a recommendation to buy or sell any stock, and does not take account of your objectives, or your financial situation. Simply Wall St has no position in the stocks mentioned. Thank you for reading.
