Why You Should Like Ausom Enterprise Limited’s (NSE:AUSOMENT) ROCE

Today we'll evaluate Ausom Enterprise Limited (NSE:AUSOMENT) to determine whether it could have potential as an investment idea. Specifically, we're going to calculate its Return On Capital Employed (ROCE), in the hopes of getting some insight into the business.
Firstly, we'll go over how we calculate ROCE. Second, we'll look at its ROCE compared to similar companies. Finally, we'll look at how its current liabilities affect its ROCE.
Understanding Return On Capital Employed (ROCE)
ROCE is a measure of a company's yearly pre-tax profit (its return), relative to the capital employed in the business. All else being equal, a better business will have a higher ROCE. In brief, it is a useful tool, but it is not without drawbacks. Renowned investment researcher Michael Mauboussin has suggested that a high ROCE can indicate that 'one dollar invested in the company generates value of more than one dollar'.
So, How Do We Calculate ROCE?
Analysts use this formula to calculate return on capital employed:
Return on Capital Employed = Earnings Before Interest and Tax (EBIT) ÷ (Total Assets - Current Liabilities)
Or for Ausom Enterprise:
0.23 = ₹170m ÷ (₹2.1b - ₹1.4b) (Based on the trailing twelve months to December 2018.)
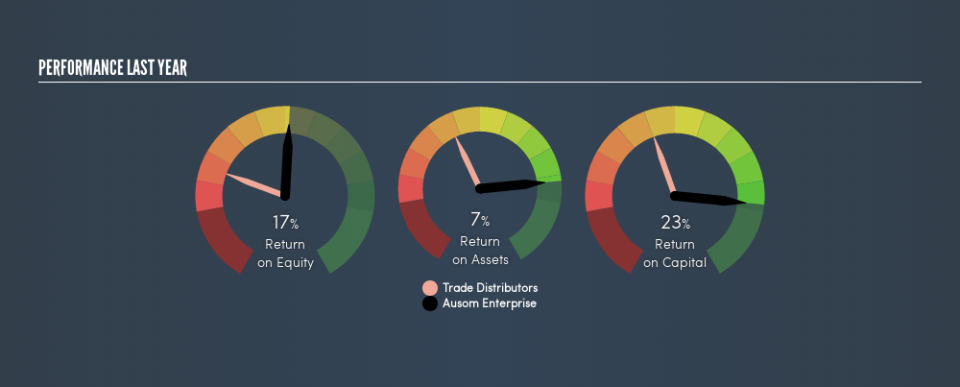
Therefore, Ausom Enterprise has an ROCE of 23%.
Want to participate in a short research study? Help shape the future of investing tools and you could win a $250 gift card!
See our latest analysis for Ausom Enterprise
Is Ausom Enterprise's ROCE Good?
ROCE is commonly used for comparing the performance of similar businesses. Ausom Enterprise's ROCE appears to be substantially greater than the 5.8% average in the Trade Distributors industry. We would consider this a positive, as it suggests it is using capital more effectively than other similar companies. Regardless of where Ausom Enterprise sits next to its industry, its ROCE in absolute terms appears satisfactory, and this company could be worth a closer look.
In our analysis, Ausom Enterprise's ROCE appears to be 23%, compared to 3 years ago, when its ROCE was 9.7%. This makes us think the business might be improving.
Remember that this metric is backwards looking - it shows what has happened in the past, and does not accurately predict the future. Companies in cyclical industries can be difficult to understand using ROCE, as returns typically look high during boom times, and low during busts. This is because ROCE only looks at one year, instead of considering returns across a whole cycle. If Ausom Enterprise is cyclical, it could make sense to check out this free graph of past earnings, revenue and cash flow.
How Ausom Enterprise's Current Liabilities Impact Its ROCE
Short term (or current) liabilities, are things like supplier invoices, overdrafts, or tax bills that need to be paid within 12 months. Due to the way ROCE is calculated, a high level of current liabilities makes a company look as though it has less capital employed, and thus can (sometimes unfairly) boost the ROCE. To counteract this, we check if a company has high current liabilities, relative to its total assets.
Ausom Enterprise has total assets of ₹2.1b and current liabilities of ₹1.4b. As a result, its current liabilities are equal to approximately 65% of its total assets. Ausom Enterprise's current liabilities are fairly high, which increases its ROCE significantly.
Our Take On Ausom Enterprise's ROCE
This ROCE is pretty good, but remember that it would look less impressive with fewer current liabilities. Ausom Enterprise looks strong on this analysis, but there are plenty of other companies that could be a good opportunity . Here is a free list of companies growing earnings rapidly.
If you are like me, then you will not want to miss this free list of growing companies that insiders are buying.
We aim to bring you long-term focused research analysis driven by fundamental data. Note that our analysis may not factor in the latest price-sensitive company announcements or qualitative material.
If you spot an error that warrants correction, please contact the editor at editorial-team@simplywallst.com. This article by Simply Wall St is general in nature. It does not constitute a recommendation to buy or sell any stock, and does not take account of your objectives, or your financial situation. Simply Wall St has no position in the stocks mentioned. Thank you for reading.
