Why Billington Holdings Plc’s (LON:BILN) Return On Capital Employed Is Impressive

Today we'll evaluate Billington Holdings Plc (LON:BILN) to determine whether it could have potential as an investment idea. To be precise, we'll consider its Return On Capital Employed (ROCE), as that will inform our view of the quality of the business.
First up, we'll look at what ROCE is and how we calculate it. Then we'll compare its ROCE to similar companies. Last but not least, we'll look at what impact its current liabilities have on its ROCE.
Understanding Return On Capital Employed (ROCE)
ROCE measures the 'return' (pre-tax profit) a company generates from capital employed in its business. Generally speaking a higher ROCE is better. Ultimately, it is a useful but imperfect metric. Author Edwin Whiting says to be careful when comparing the ROCE of different businesses, since 'No two businesses are exactly alike.
So, How Do We Calculate ROCE?
The formula for calculating the return on capital employed is:
Return on Capital Employed = Earnings Before Interest and Tax (EBIT) ÷ (Total Assets - Current Liabilities)
Or for Billington Holdings:
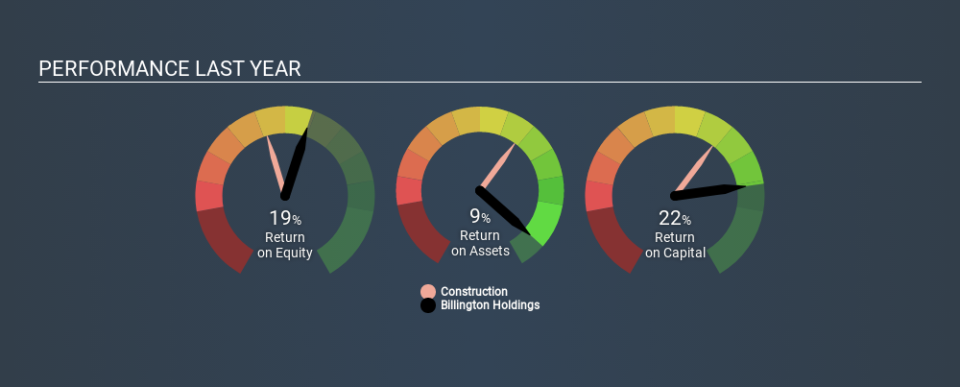
0.22 = UK£5.7m ÷ (UK£50m - UK£24m) (Based on the trailing twelve months to June 2019.)
Therefore, Billington Holdings has an ROCE of 22%.
Check out our latest analysis for Billington Holdings
Is Billington Holdings's ROCE Good?
ROCE can be useful when making comparisons, such as between similar companies. Billington Holdings's ROCE appears to be substantially greater than the 18% average in the Construction industry. We consider this a positive sign, because it suggests it uses capital more efficiently than similar companies. Regardless of the industry comparison, in absolute terms, Billington Holdings's ROCE currently appears to be excellent.
Our data shows that Billington Holdings currently has an ROCE of 22%, compared to its ROCE of 16% 3 years ago. This makes us think about whether the company has been reinvesting shrewdly. You can click on the image below to see (in greater detail) how Billington Holdings's past growth compares to other companies.
When considering ROCE, bear in mind that it reflects the past and does not necessarily predict the future. Companies in cyclical industries can be difficult to understand using ROCE, as returns typically look high during boom times, and low during busts. ROCE is, after all, simply a snap shot of a single year. What happens in the future is pretty important for investors, so we have prepared a free report on analyst forecasts for Billington Holdings.
What Are Current Liabilities, And How Do They Affect Billington Holdings's ROCE?
Current liabilities are short term bills and invoices that need to be paid in 12 months or less. Due to the way ROCE is calculated, a high level of current liabilities makes a company look as though it has less capital employed, and thus can (sometimes unfairly) boost the ROCE. To counter this, investors can check if a company has high current liabilities relative to total assets.
Billington Holdings has total liabilities of UK£24m and total assets of UK£50m. Therefore its current liabilities are equivalent to approximately 48% of its total assets. Billington Holdings's ROCE is boosted somewhat by its middling amount of current liabilities.
The Bottom Line On Billington Holdings's ROCE
Still, it has a high ROCE, and may be an interesting prospect for further research. Billington Holdings shapes up well under this analysis, but it is far from the only business delivering excellent numbers . You might also want to check this free collection of companies delivering excellent earnings growth.
I will like Billington Holdings better if I see some big insider buys. While we wait, check out this free list of growing companies with considerable, recent, insider buying.
If you spot an error that warrants correction, please contact the editor at editorial-team@simplywallst.com. This article by Simply Wall St is general in nature. It does not constitute a recommendation to buy or sell any stock, and does not take account of your objectives, or your financial situation. Simply Wall St has no position in the stocks mentioned.
We aim to bring you long-term focused research analysis driven by fundamental data. Note that our analysis may not factor in the latest price-sensitive company announcements or qualitative material. Thank you for reading.

